Difference between revisions of "Change And Correlation"
(→Slide 19) |
|||
| (17 intermediate revisions by the same user not shown) | |||
| Line 2: | Line 2: | ||
=== Slide 1: Intro === | === Slide 1: Intro === | ||
| + | [[Image:ChangesOnTrees.001-001.png]] | ||
=== Slide 2: Intro === | === Slide 2: Intro === | ||
| + | [[Image:ChangesOnTrees.002-001.png]] | ||
=== Slide 3: Intro === | === Slide 3: Intro === | ||
| + | [[Image:ChangesOnTrees.003-001.png]] | ||
=== Slide 4: Start screen === | === Slide 4: Start screen === | ||
| + | [[Image:ChangesOnTrees.004-001.png]] | ||
| − | === Slide 5 === | + | === Slide 5: Selecting opercle === |
| + | [[Image:ChangesOnTrees.005-001.png]] | ||
| − | === Slide 6 === | + | === Slide 6: opercle summary === |
| + | Select taxonomic distribution of phenotypes (this page may be out of sequence if there is another page between the one on slide 5 and this one). | ||
| + | [[Image:ChangesOnTrees.006-001.png]] | ||
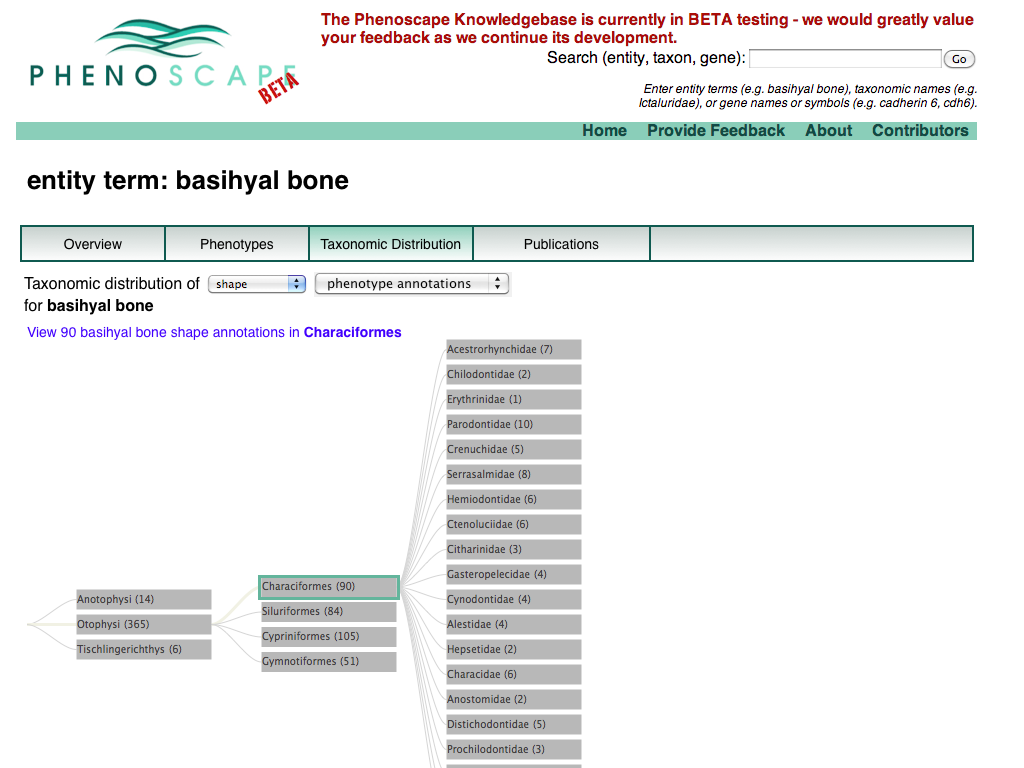
| − | === Slide 7 === | + | === Slide 7: Taxonomic Distribution of Phenotype Annotations=== |
| + | [[Image:ChangesOnTrees.007-001.png]] | ||
| − | === Slide 8 === | + | === Slide 8: Specifying the phenotype to attribute === |
| + | [[Image:ChangesOnTrees.008-001.png]] | ||
| − | === Slide 9 === | + | === Slide 9: Selecting shape attribute === |
| + | [[Image:ChangesOnTrees.009-001.png]] | ||
| − | === Slide 10 === | + | === Slide 10: Switching from counts of phenotype annotations to display of variability === |
| + | [[Image:ChangesOnTrees.010-001.png]] | ||
| − | === Slide 11 === | + | === Slide 11: Phenotype variation display === |
| + | [[Image:ChangesOnTrees.011-001.png]] | ||
| − | === Slide 12 === | + | === Slide 12: Selecting from a list of taxa where variability was detected === |
| + | [[Image:ChangesOnTrees.012-001.png]] | ||
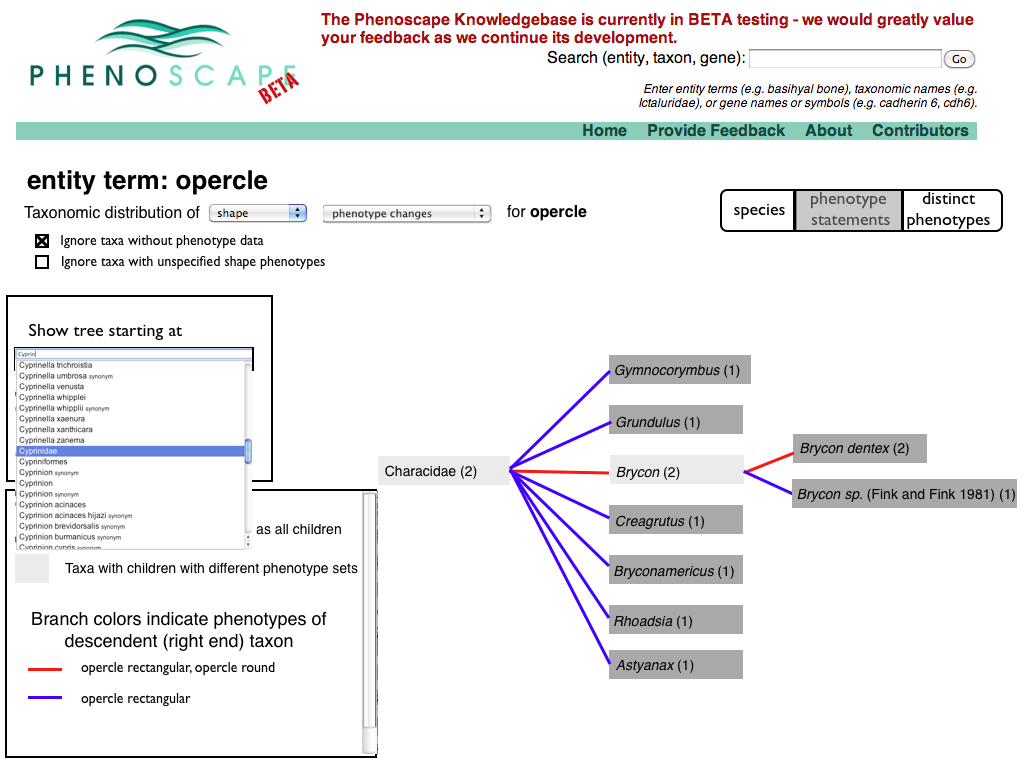
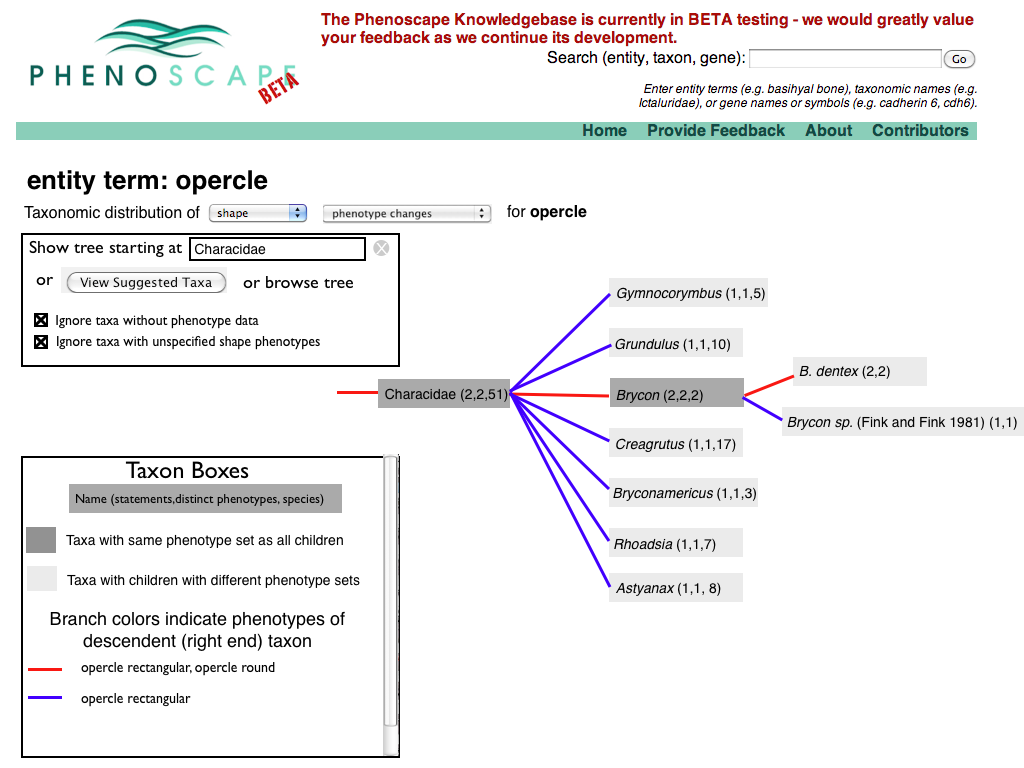
| − | === Slide 13 === | + | === Slide 13: Phenotype variation display for Characidae === |
| + | [[Image:ChangesOnTrees.013-001.png]] | ||
=== Slide 14 === | === Slide 14 === | ||
| + | [[Image:ChangesOnTrees.014-001.png]] | ||
=== Slide 15 === | === Slide 15 === | ||
| + | [[Image:ChangesOnTrees.015-001.png]] | ||
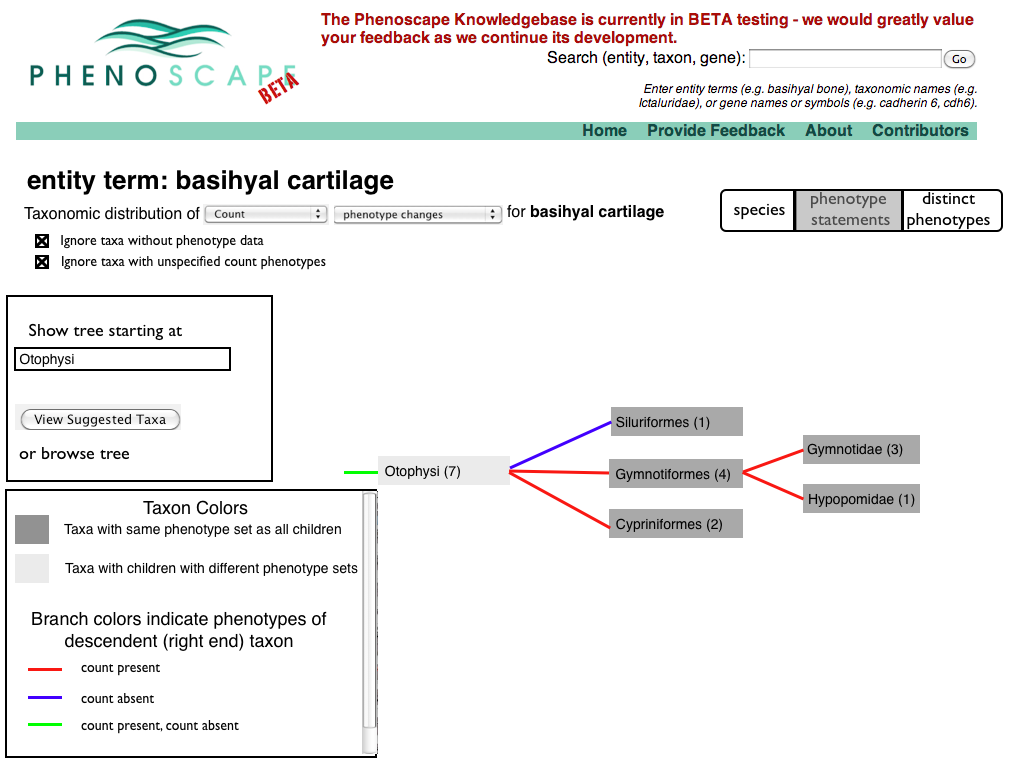
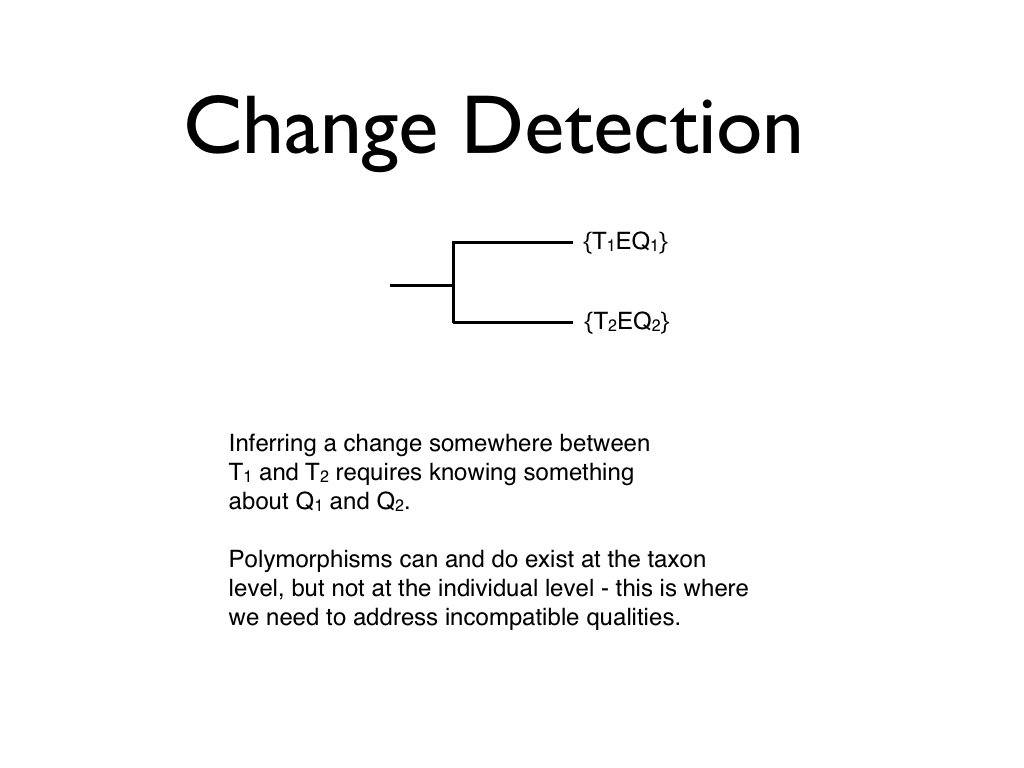
=== Slide 16 === | === Slide 16 === | ||
| + | [[Image:ChangesOnTrees.016-001.png]] | ||
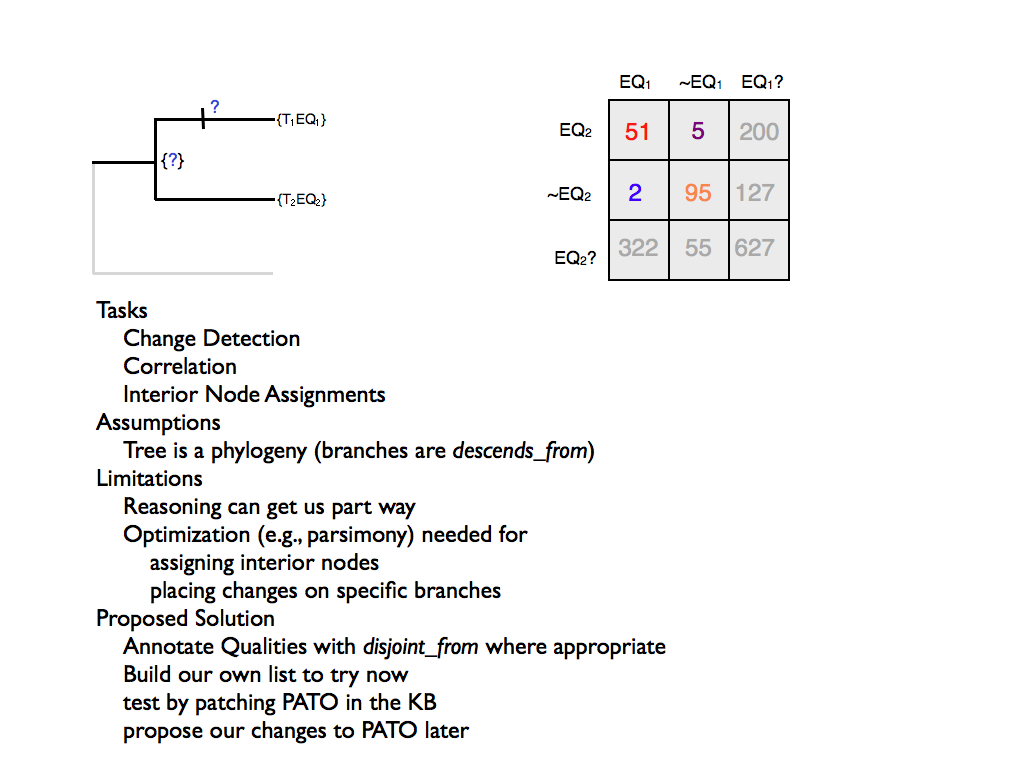
=== Slide 17 === | === Slide 17 === | ||
| + | [[Image:ChangesOnTrees.017-001.png]] | ||
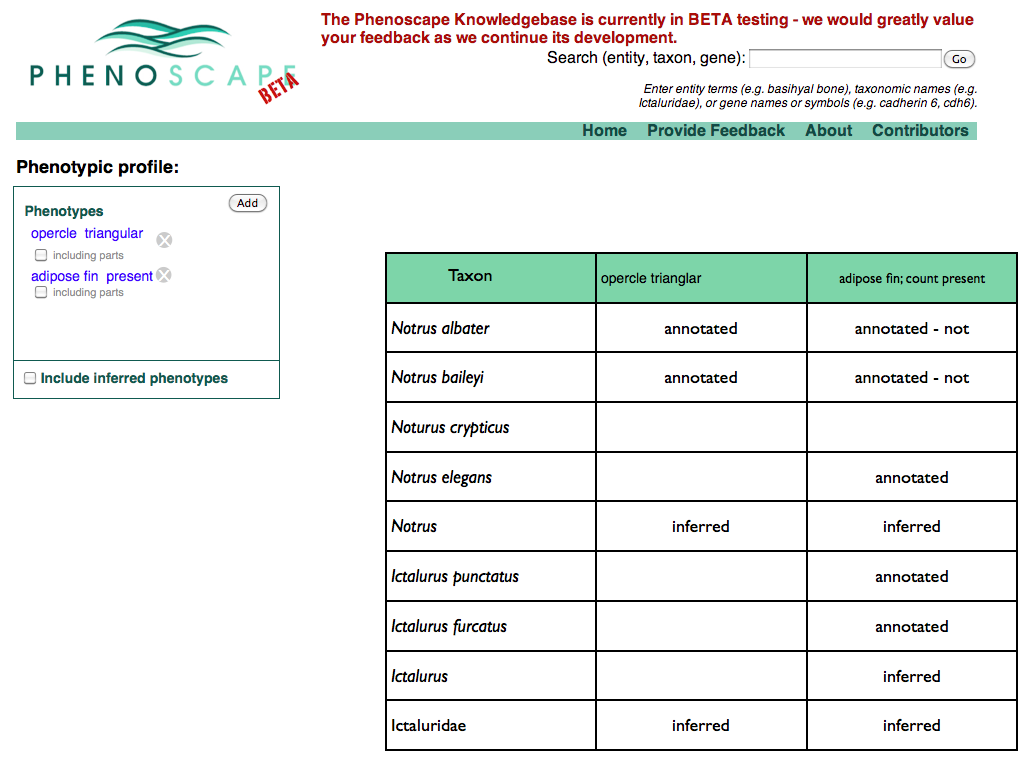
=== Slide 18 === | === Slide 18 === | ||
| + | [[Image:ChangesOnTrees.018-001.png]] | ||
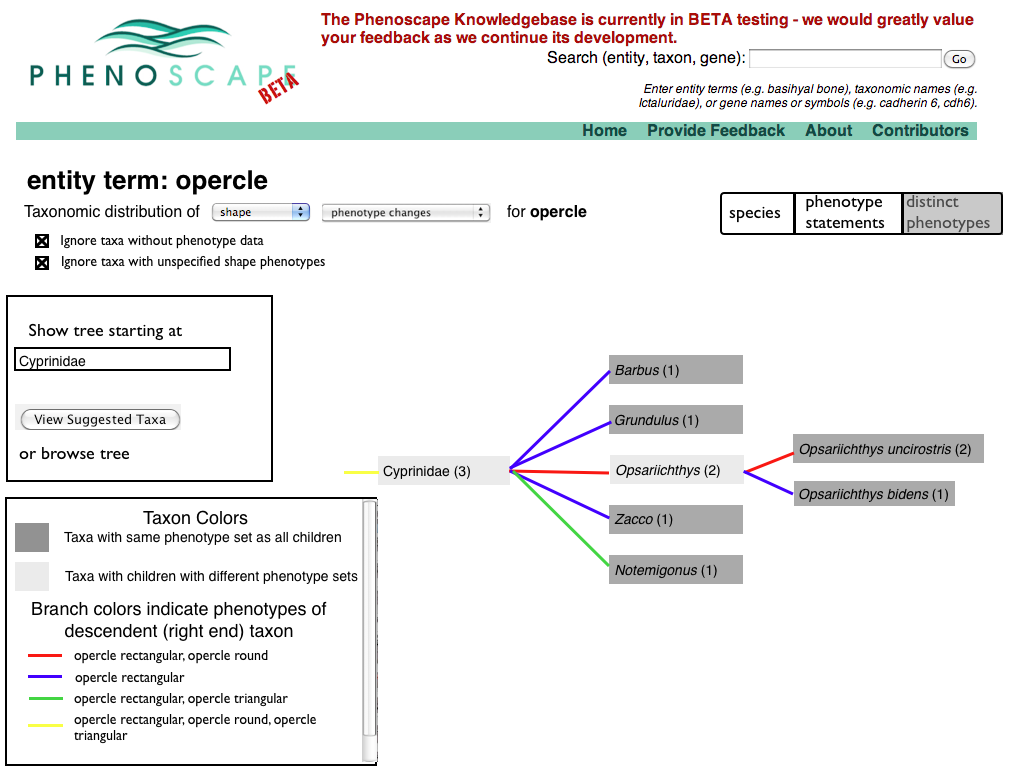
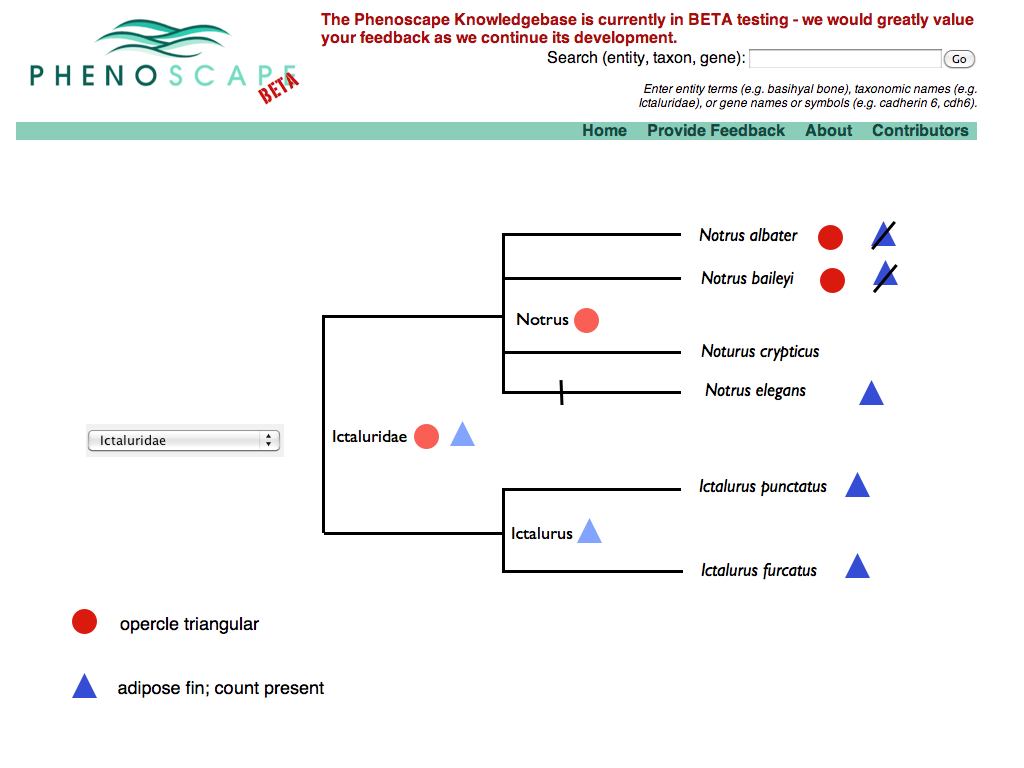
=== Slide 19 === | === Slide 19 === | ||
| + | [[Image:ChangesOnTrees.020-001.png]] | ||
| − | === | + | === Captioned Alternative (compare slide 13) === |
| − | + | [[Image:CaptionedVersion.013-001.png]] | |
== Version 2== | == Version 2== | ||
Latest revision as of 20:55, 29 April 2010
Contents
- 1 Version 3 (19 April 2010)
- 1.1 Slide 1: Intro
- 1.2 Slide 2: Intro
- 1.3 Slide 3: Intro
- 1.4 Slide 4: Start screen
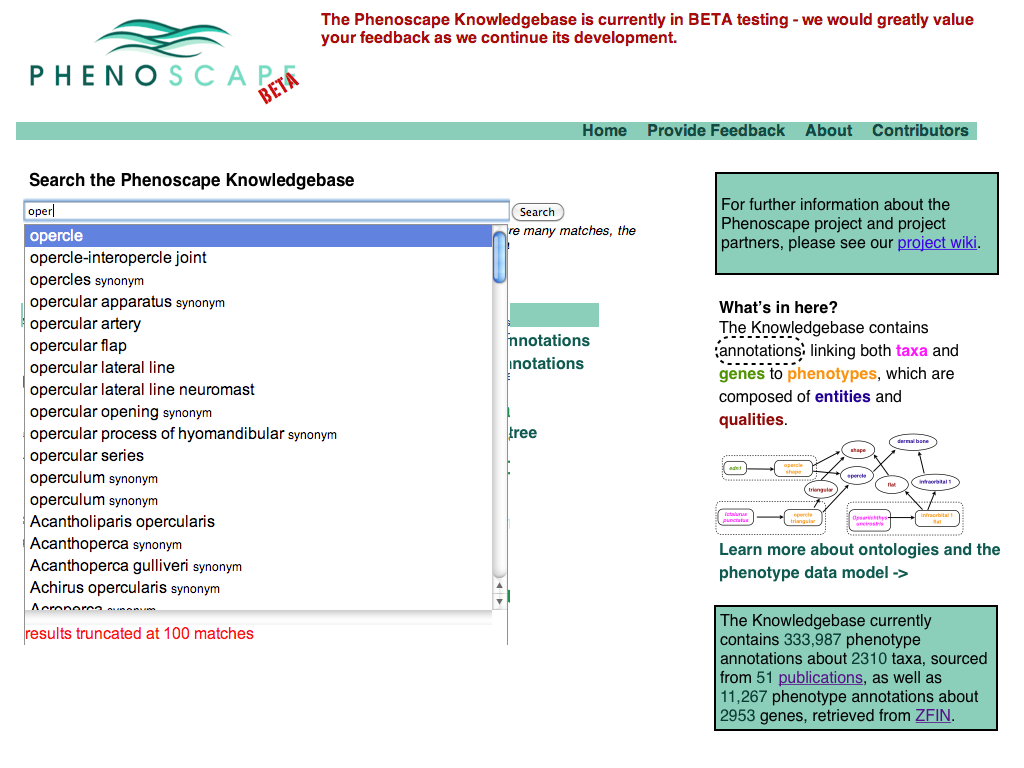
- 1.5 Slide 5: Selecting opercle
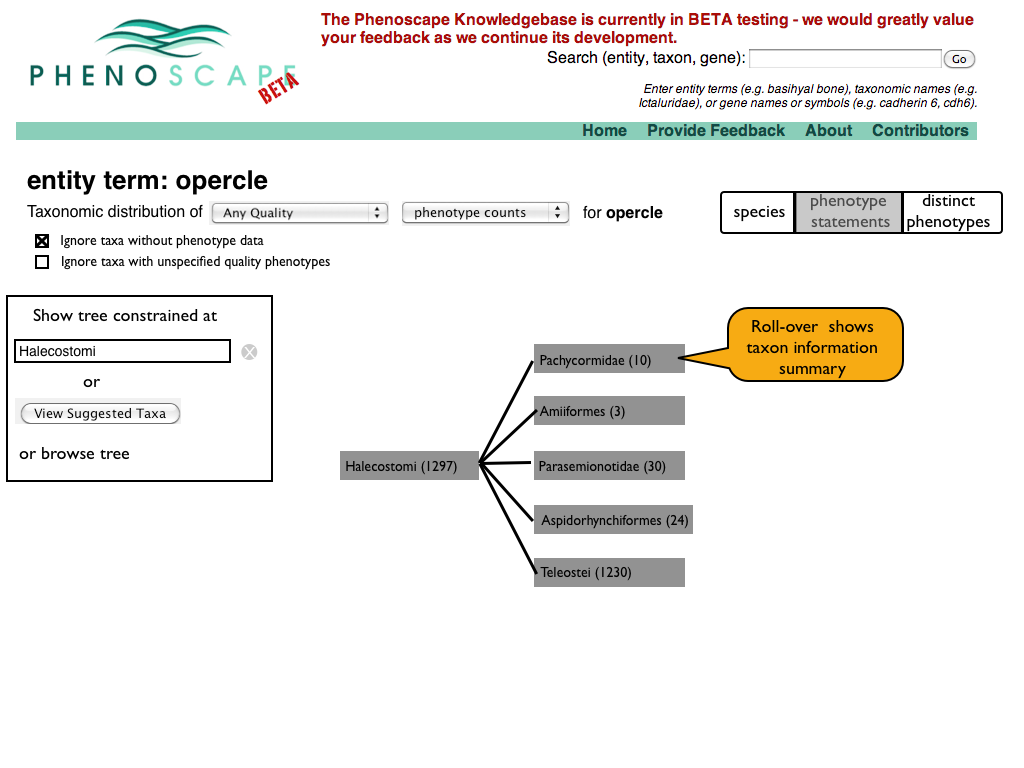
- 1.6 Slide 6: opercle summary
- 1.7 Slide 7: Taxonomic Distribution of Phenotype Annotations
- 1.8 Slide 8: Specifying the phenotype to attribute
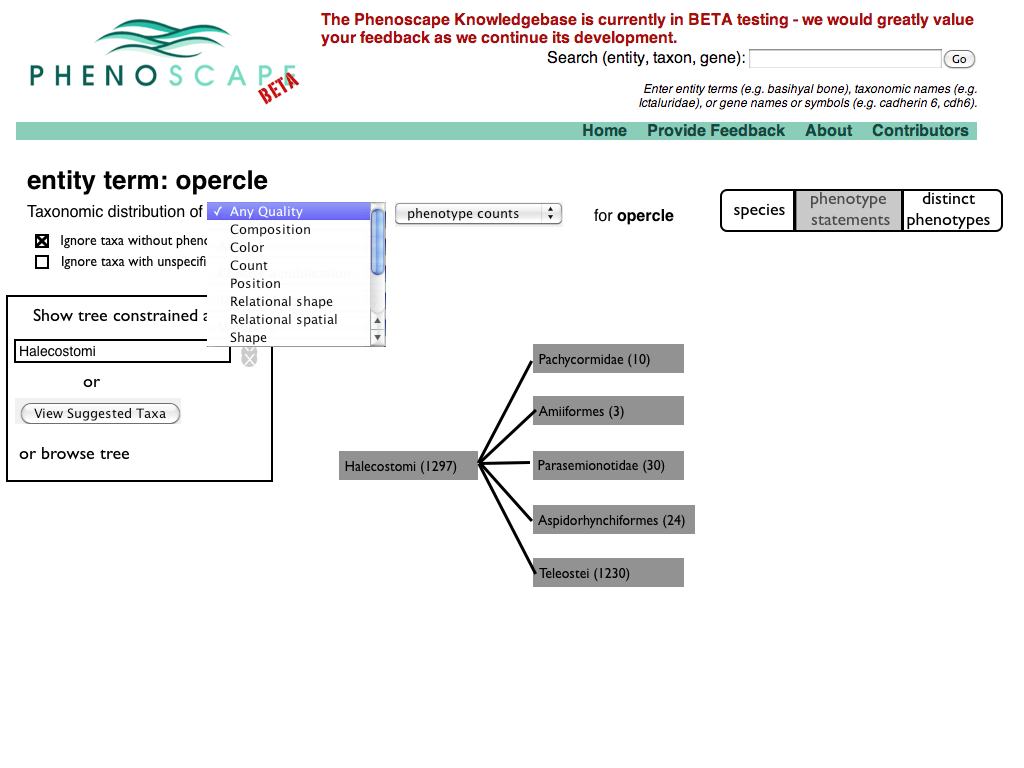
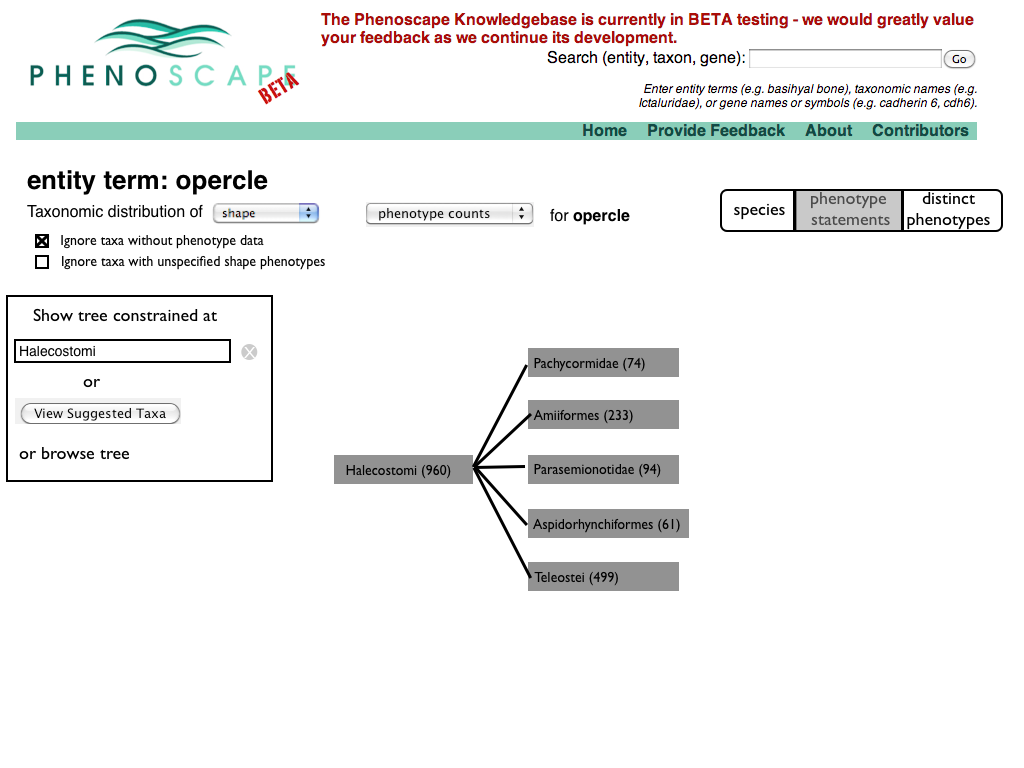
- 1.9 Slide 9: Selecting shape attribute
- 1.10 Slide 10: Switching from counts of phenotype annotations to display of variability
- 1.11 Slide 11: Phenotype variation display
- 1.12 Slide 12: Selecting from a list of taxa where variability was detected
- 1.13 Slide 13: Phenotype variation display for Characidae
- 1.14 Slide 14
- 1.15 Slide 15
- 1.16 Slide 16
- 1.17 Slide 17
- 1.18 Slide 18
- 1.19 Slide 19
- 1.20 Captioned Alternative (compare slide 13)
- 2 Version 2
- 3 Notes from April 7, 2010 meeting
- 4 Version 1
- 4.1 Slide 1: Intro page
- 4.2 Slide 2: January Tree Display
- 4.3 Slide 3: Current Tree Co-occurance Display
- 4.4 Slide 4: A Phenotype by Taxon matrix we could have had
- 4.5 Slide 5: A tree with negative data and a detected change
- 4.6 Slide 6: A Phenotype by Taxon matrix with negative annotations
- 4.7 Slide 7: Change and Correlation diagrams and overview
- 4.8 Slide 8: Change Detection using incompatible qualities
- 4.9 Slide 9: Change Detection between individuals, using gene-tree species-tree
- 4.10 Slide 10: Disjoint_with and incompatible qualities
- 4.11 Slide 11: Changing PATO
- 4.12 Slide 12: Patching Process Flow
- 4.13 Slide 13: PATO breakdown by attribute
- 4.14 Slide 14: Incompatibility and Relational Qualities
- 4.15 Slide 15: Transition to Correlation
- 4.16 Slide 16: Correlation and Contingency Tables
- 4.17 Slide 17: Reasoning only takes us so far
- 5 Notes from March 30, 2010 meeting
Version 3 (19 April 2010)
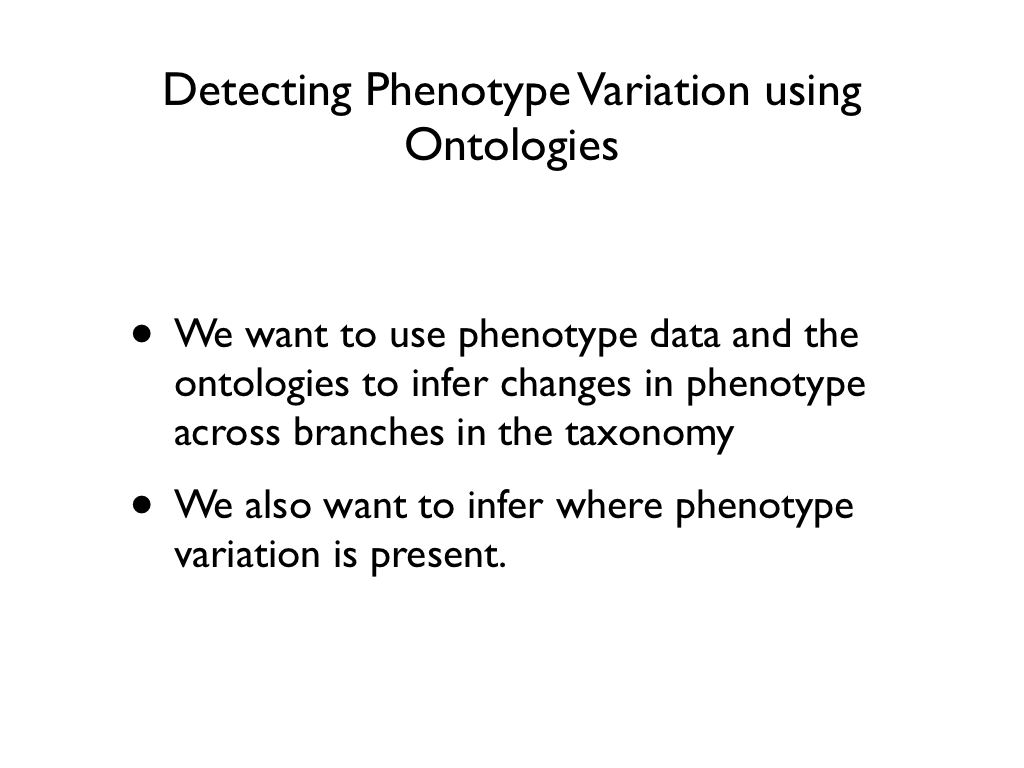
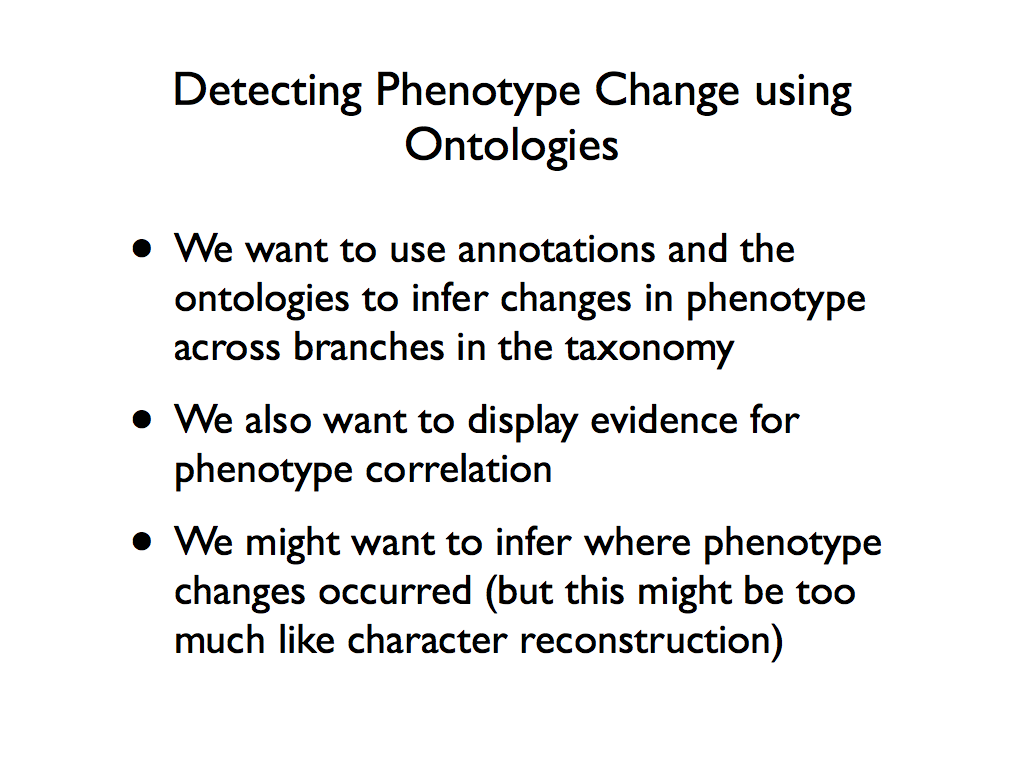
Slide 1: Intro
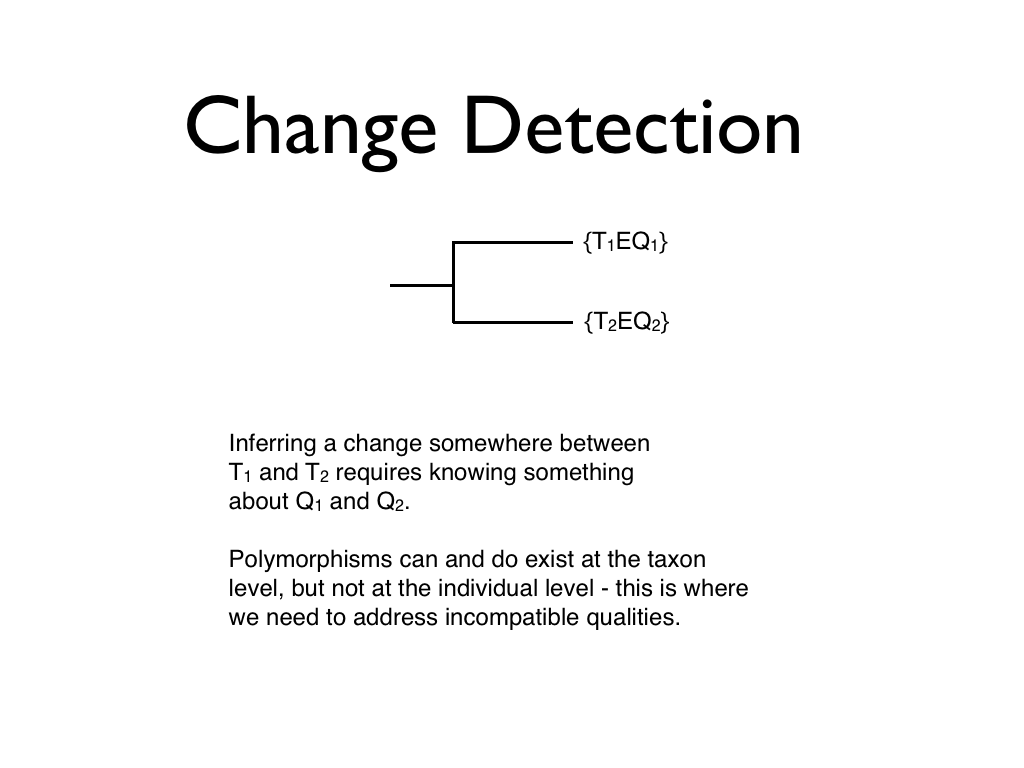
Slide 2: Intro
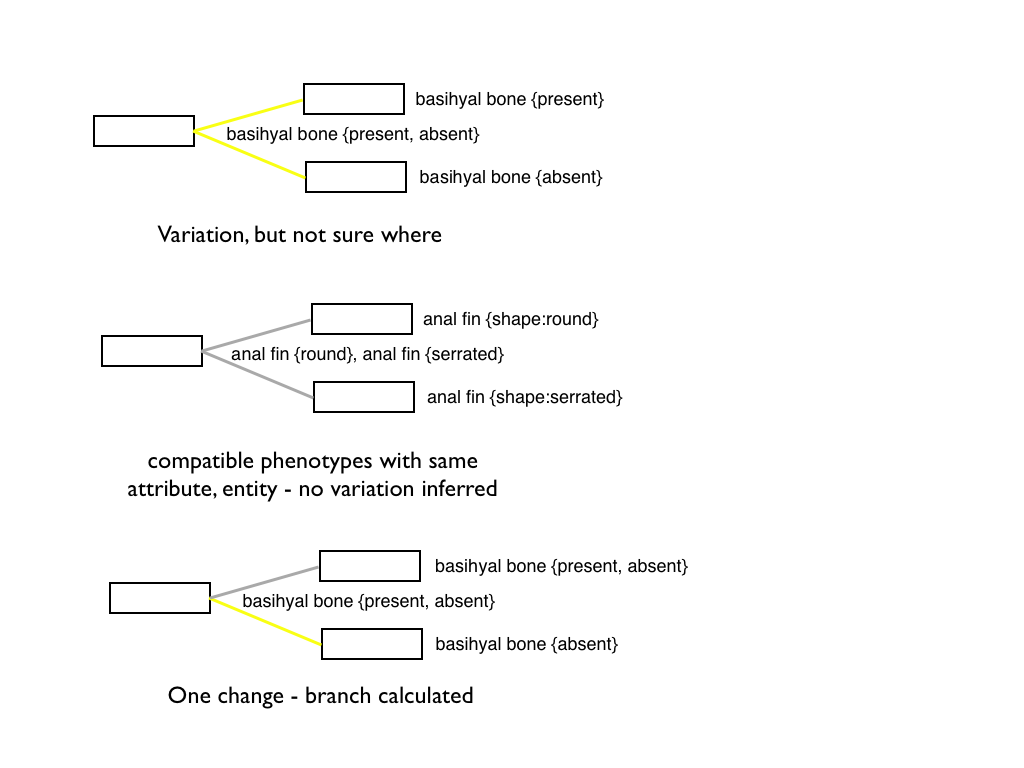
Slide 3: Intro
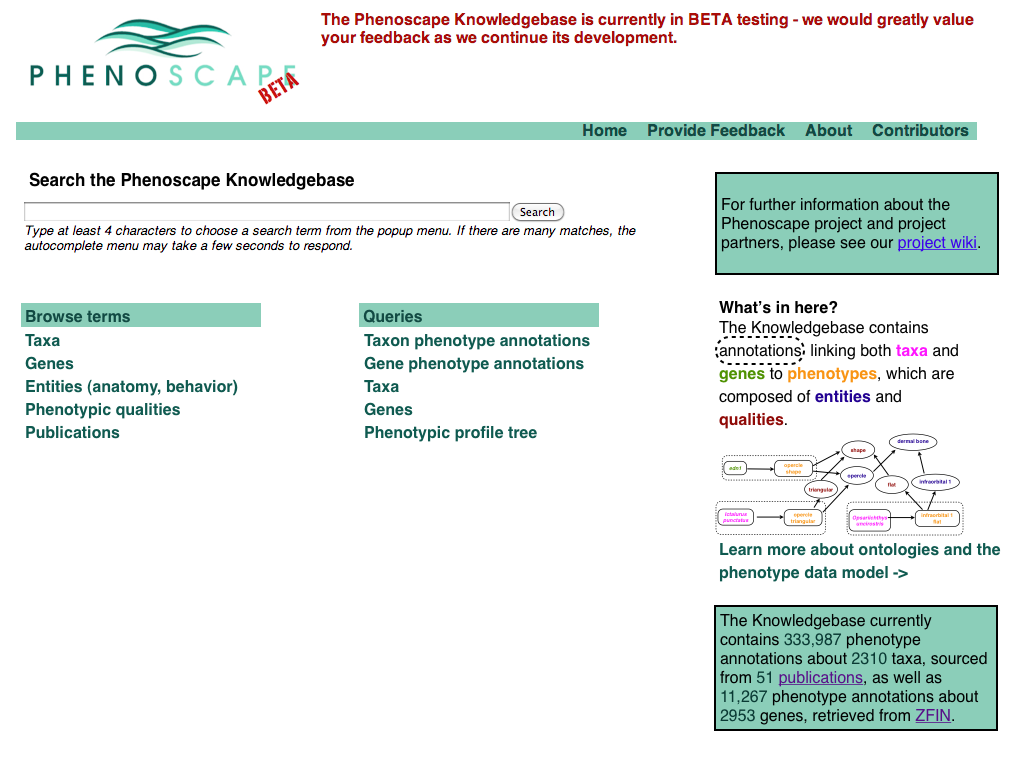
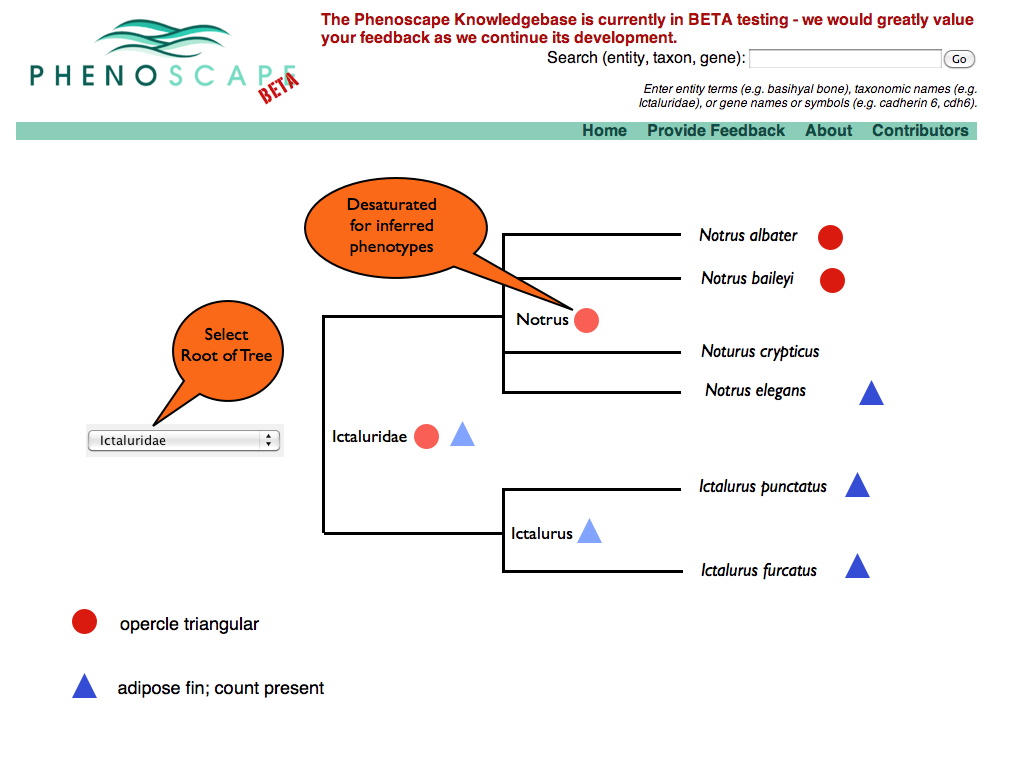
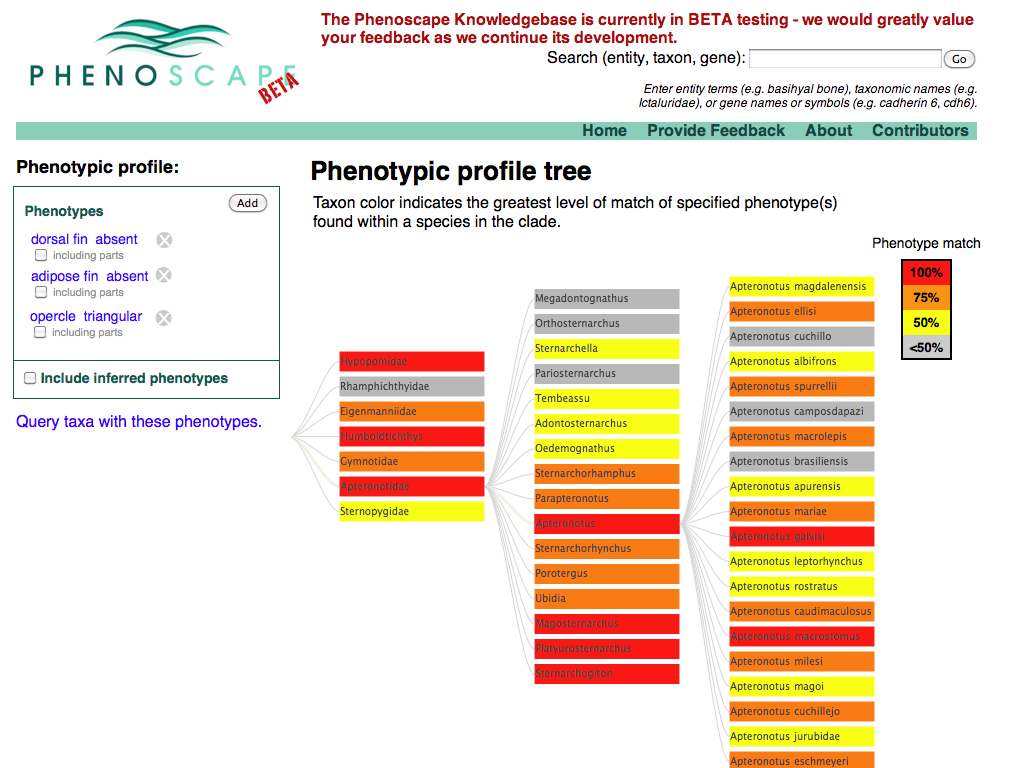
Slide 4: Start screen
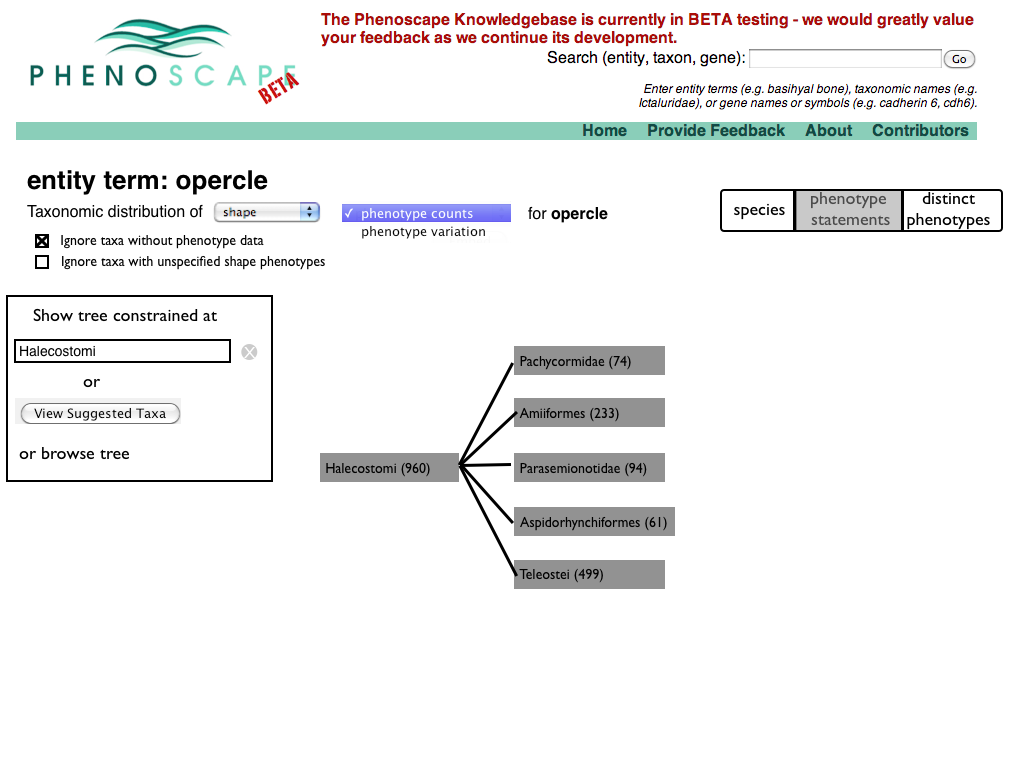
Slide 5: Selecting opercle
Slide 6: opercle summary
Select taxonomic distribution of phenotypes (this page may be out of sequence if there is another page between the one on slide 5 and this one).
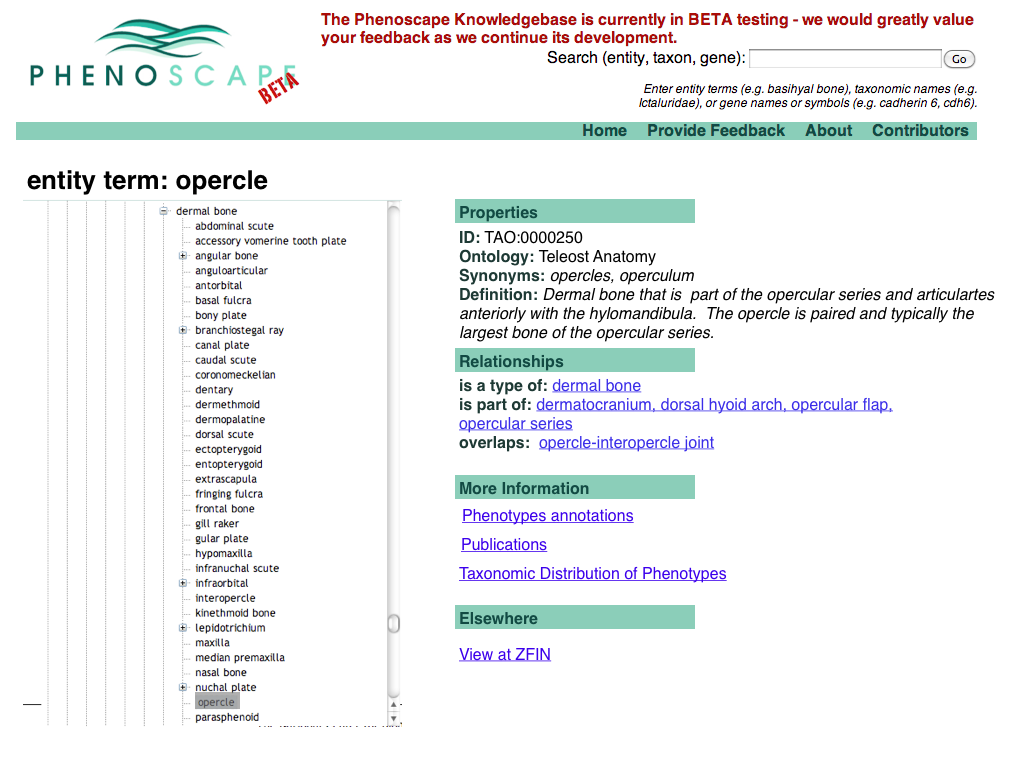
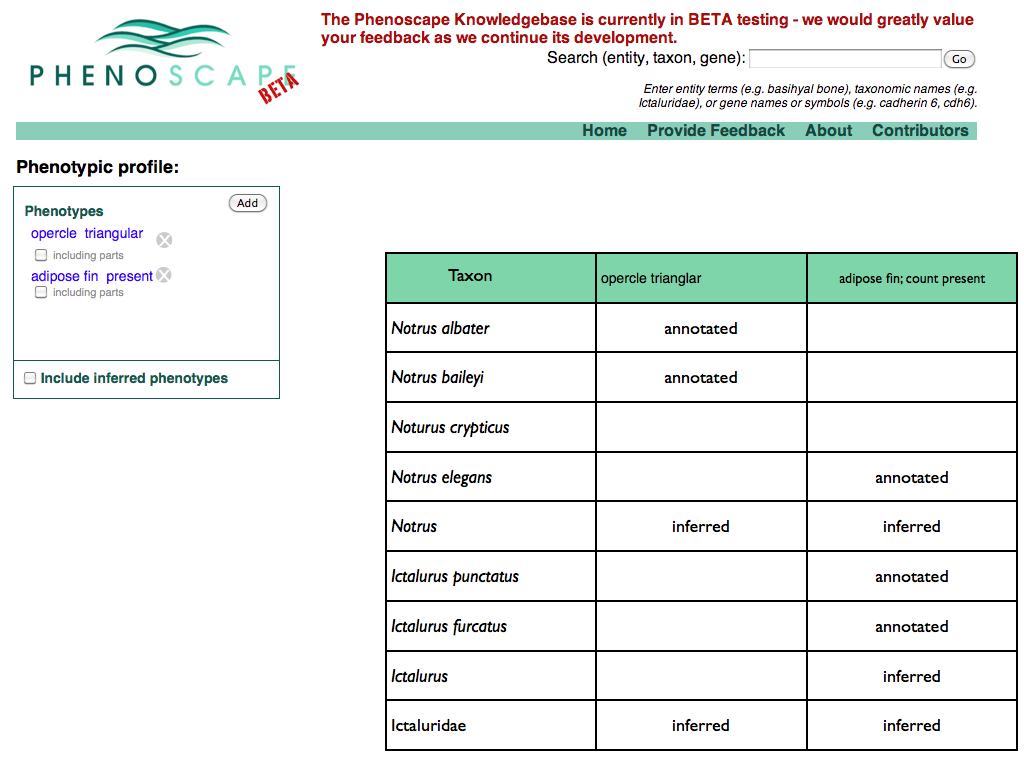
Slide 7: Taxonomic Distribution of Phenotype Annotations
Slide 8: Specifying the phenotype to attribute
Slide 9: Selecting shape attribute
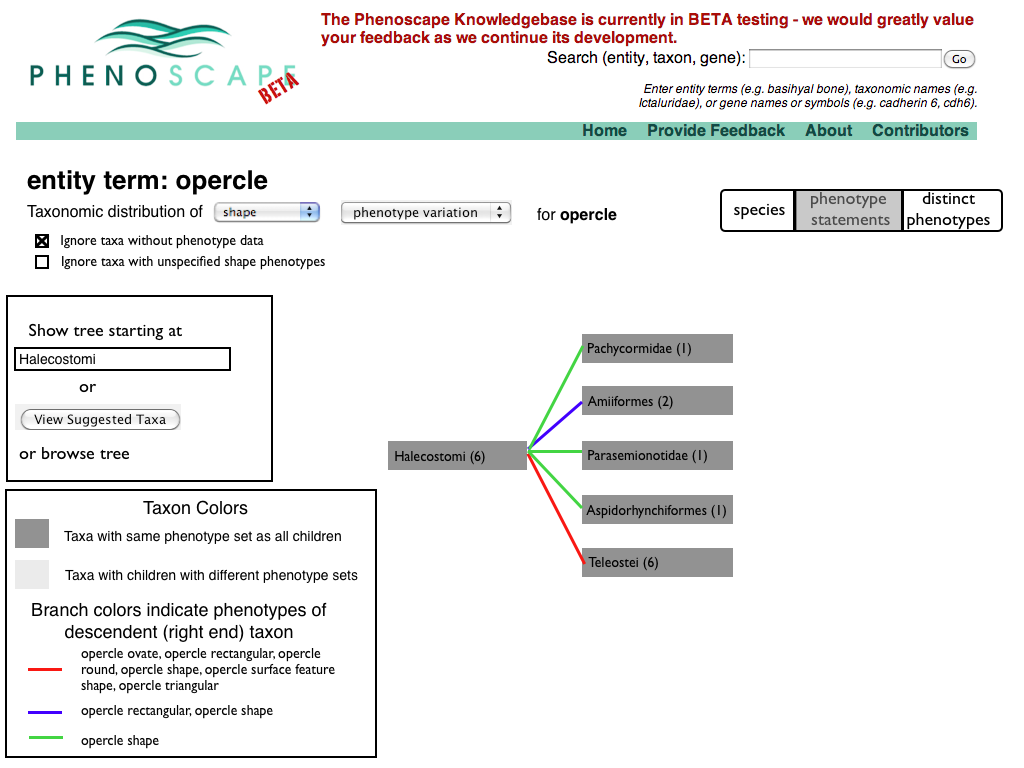
Slide 10: Switching from counts of phenotype annotations to display of variability
Slide 11: Phenotype variation display
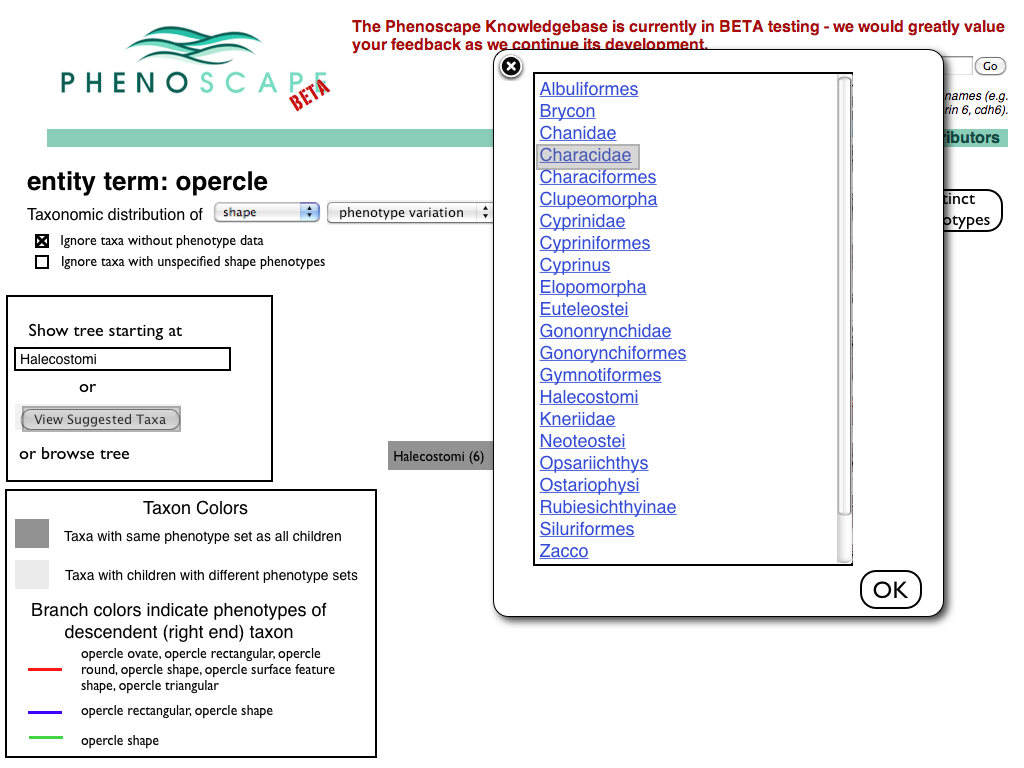
Slide 12: Selecting from a list of taxa where variability was detected
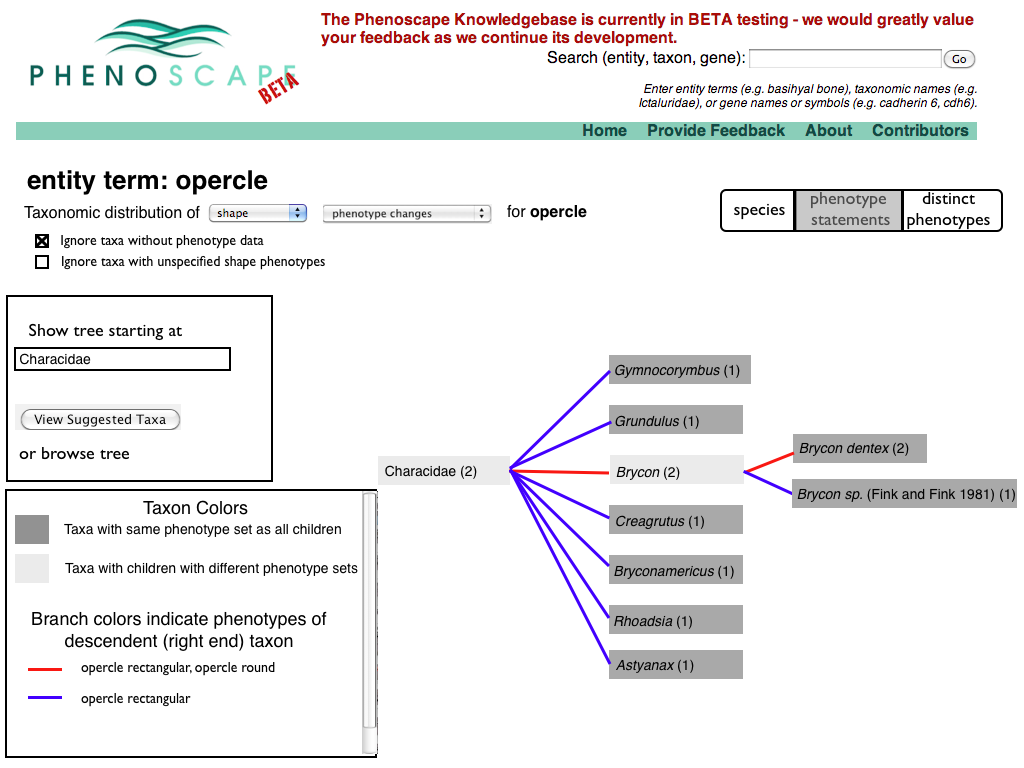
Slide 13: Phenotype variation display for Characidae
Slide 14
Slide 15
Slide 16
Slide 17
Slide 18
Slide 19
Captioned Alternative (compare slide 13)
Version 2
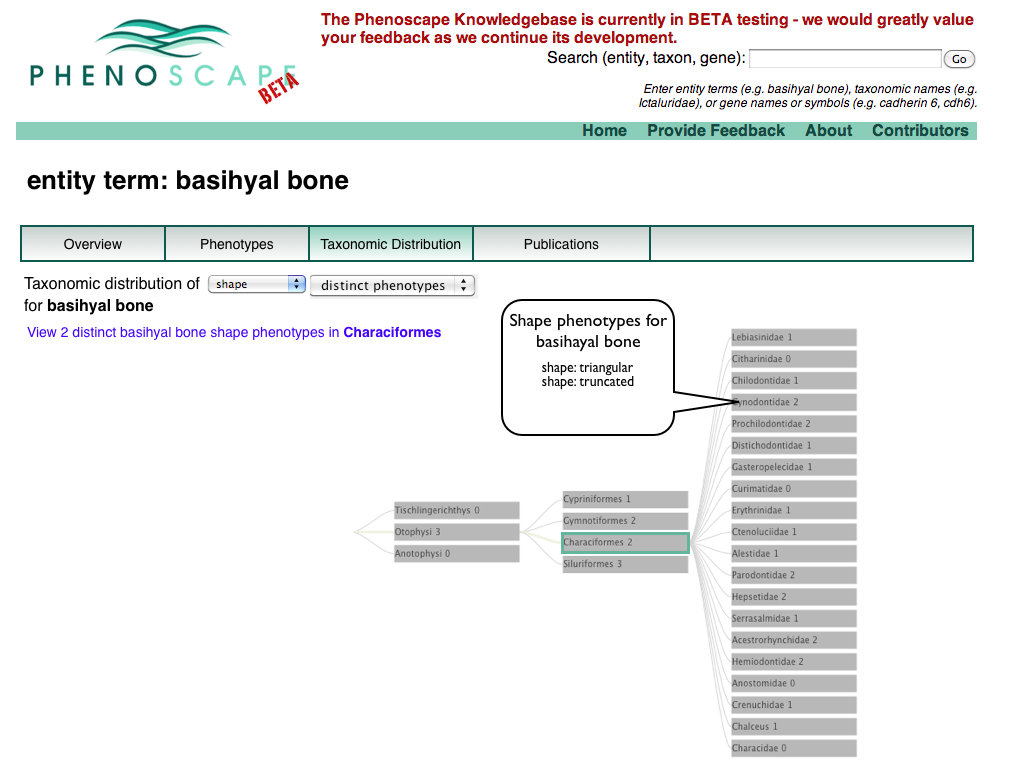
Slide 1: Modifying Distribution of Taxonomic Distribution page
Slide 2: Taxonomic Distribution of Distinct Phenotypes
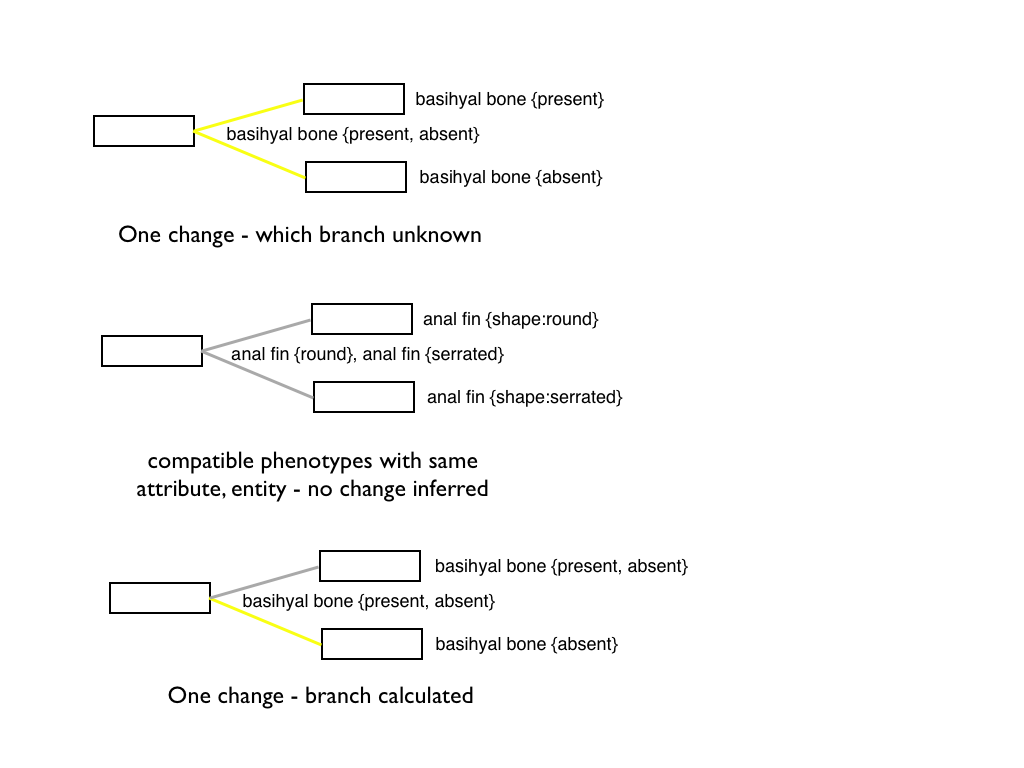
Slide 3: Summary of change counting
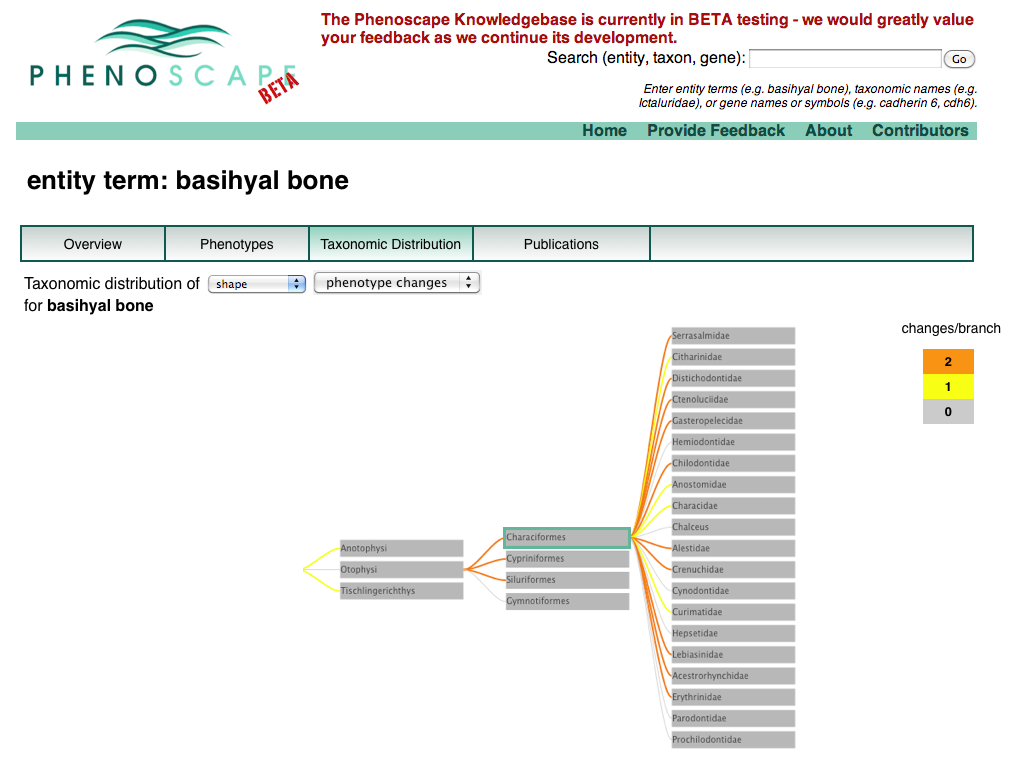
Slide 4: Taxonomic Distribution Phenotype Changes
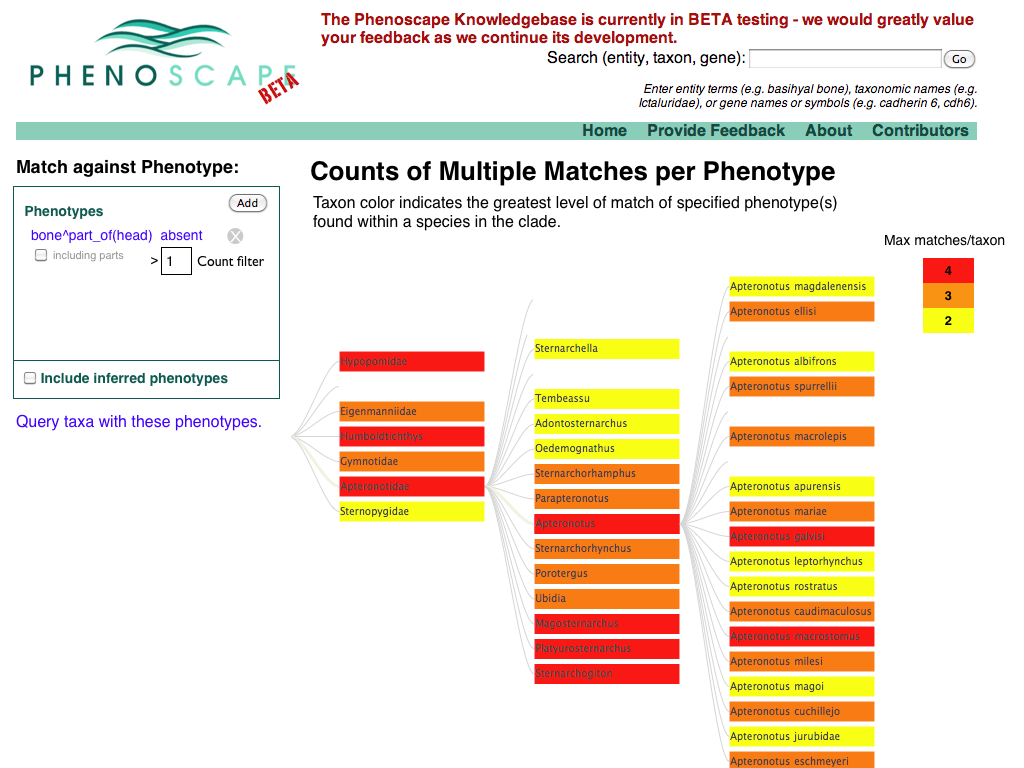
Slide 5: Multiple Matches of Phenotype per Taxon
Notes from April 7, 2010 meeting
Attending: Wasila Dahdul, Todd Vision, Paula Mabee, Peter Midford.
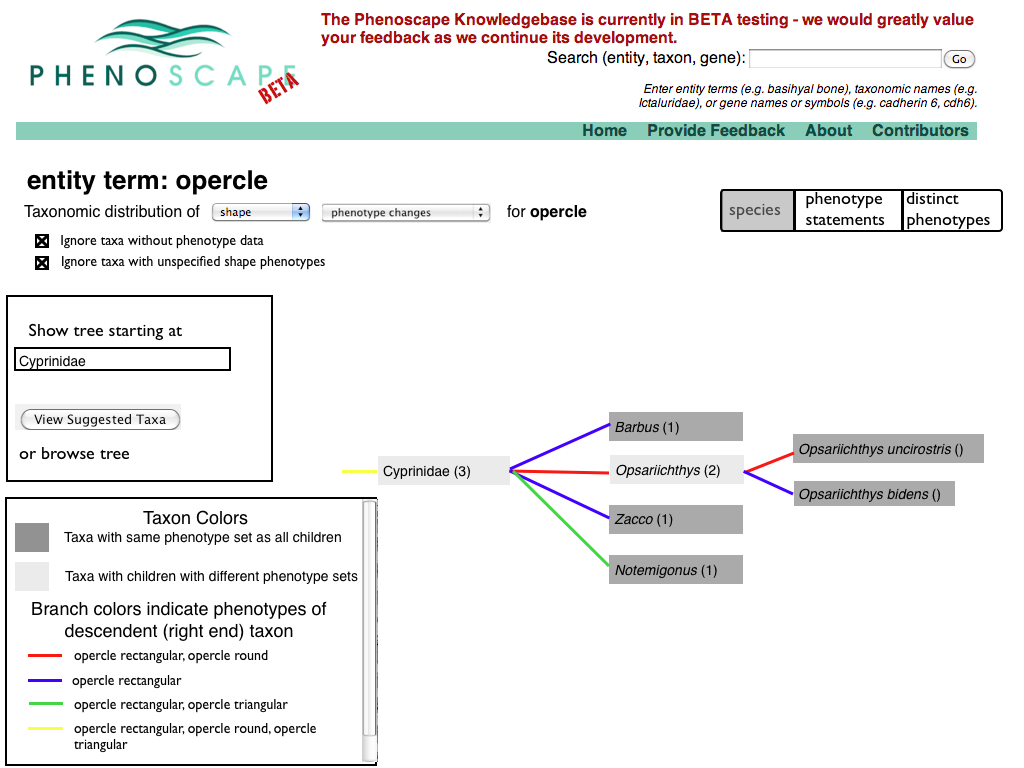
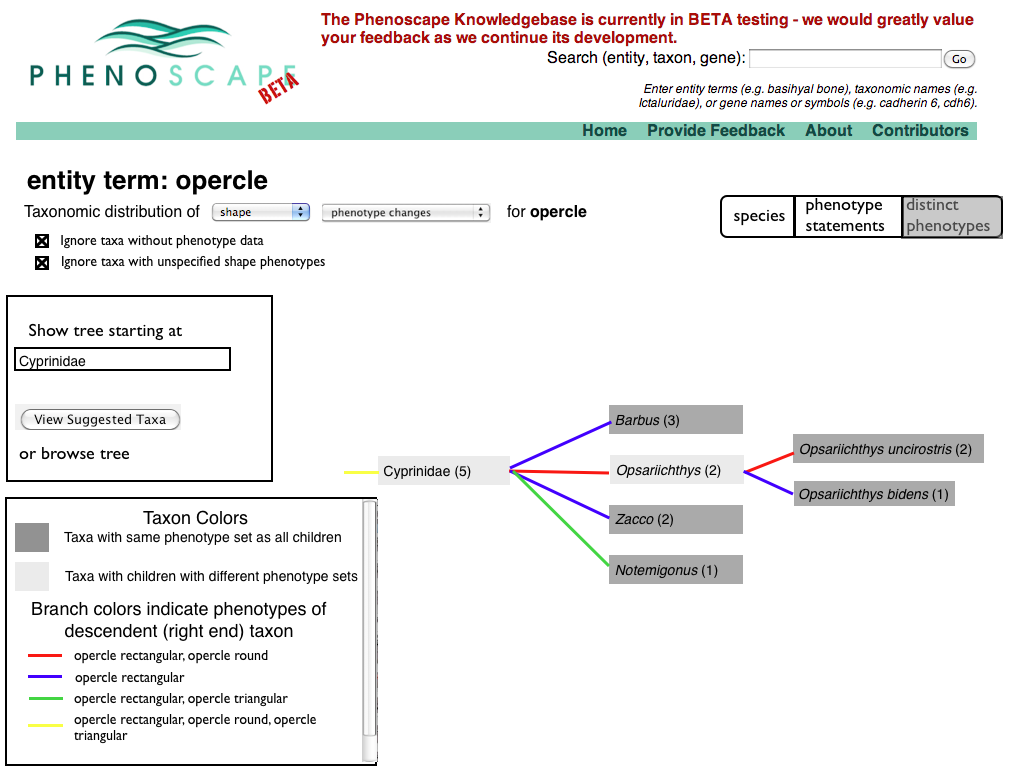
TJV suggested adding a toggle to suppress display of taxa without phenotypes in both the annotation count and distinct phenotype counts (e.g., no zero counts). There was strong sense that the exist use case write-ups weren't quite sufficient to build use scenarios for testing - how might a user get to the point of asking the questions slides 2&4 would answer. In particular, if the user was interested in changes in a particular phenotype, starting from either a taxon summary or a zebrafish gene summary, how could they identify an appropriate taxonomic scope for the query. After PM left the meeting, TJV it should be possible to go from a phenotype page to a list of taxa where change was detected. This list might take the form of a taxonomy tree pruned to include only the taxa where changes occurred. From this tree, the user could select a taxon to root the taxonomic distribution display.
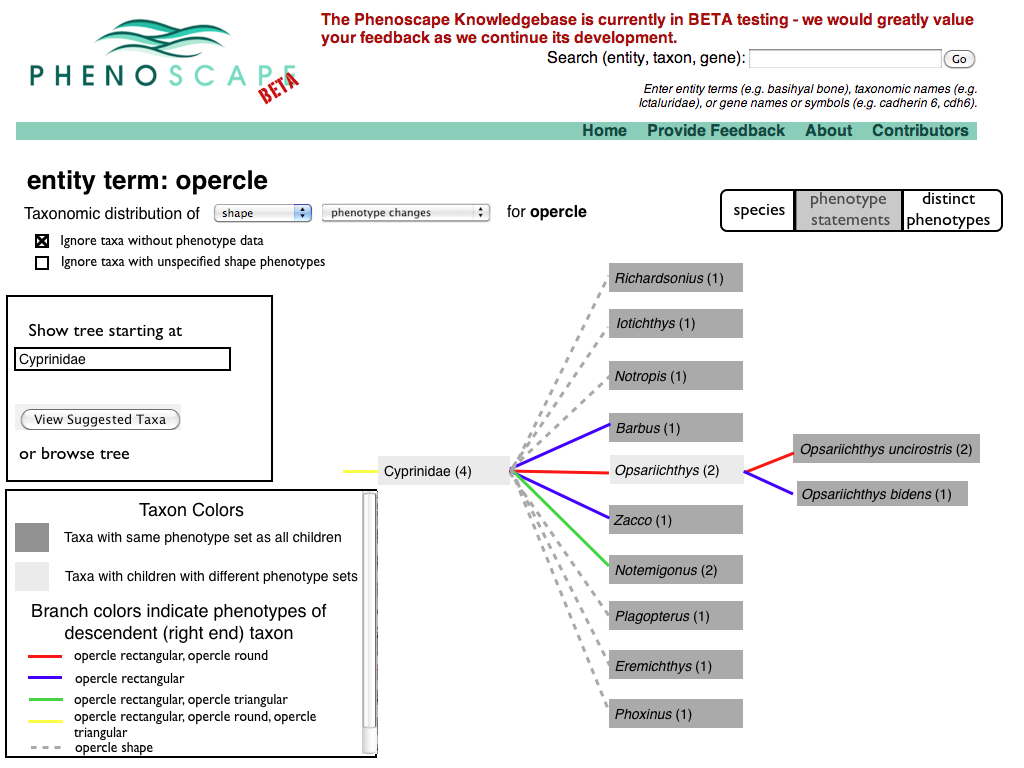
TJV also suggested that the displays on slides 2&4 should be merged - use a different form of highlighting to indicate nodes where change occurred (union of annotations of daughters not equal the intersection of annotations). There was some discussion of the current highlighting with a thickened border to indicate the focal node in the display (apparently this came out of discussion in Chicago). TJV suggested maybe changing the gray level in taxon boxes where change was detected. It was also suggested that colors on branches could be used to identify annotation sets of daughters (not individual annotations). This would allow seeing which daughters had the same sets of phenotypes and a legend could be added to specify the phenotype sets associated with each color. This would supplement, but wouldn't necessary supersede the pop-up on slide 2 (also intended for slide 4).
We did not discuss slide 5 as the use case it addressed (multiple matches of a phenotype in a single taxon) was considered too low a priority to devote effort to at this point.
Version 1
Slide 1: Intro page
Slide 2: January Tree Display
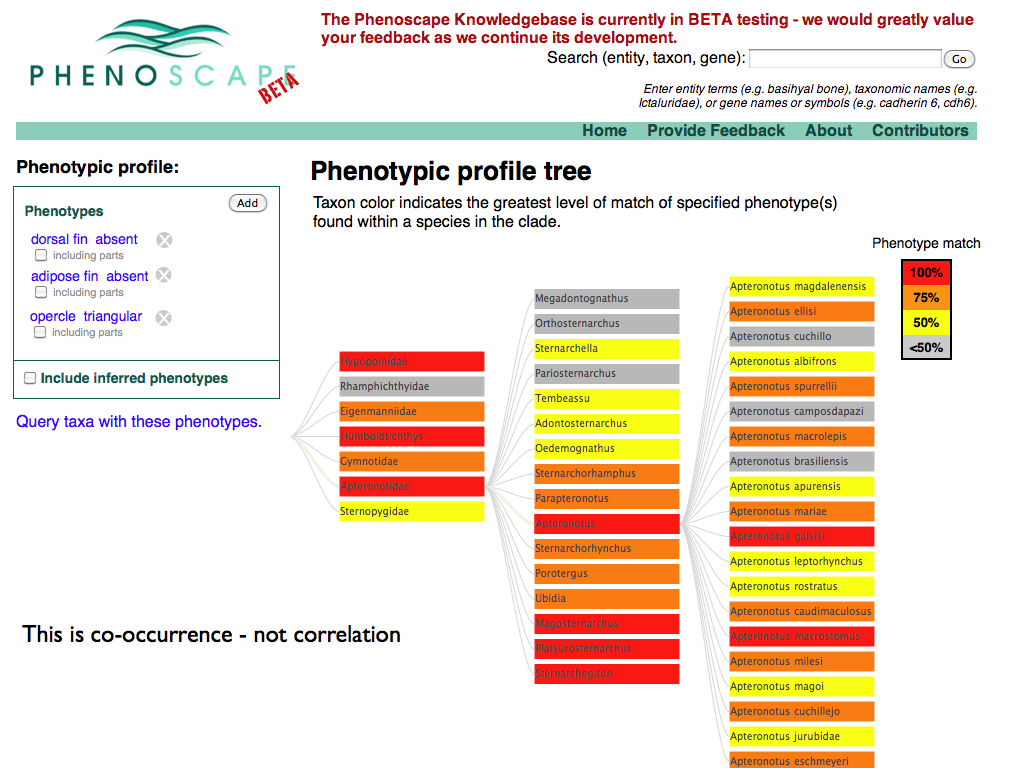
Slide 3: Current Tree Co-occurance Display
Slide 4: A Phenotype by Taxon matrix we could have had
Slide 5: A tree with negative data and a detected change
Slide 6: A Phenotype by Taxon matrix with negative annotations
Slide 7: Change and Correlation diagrams and overview
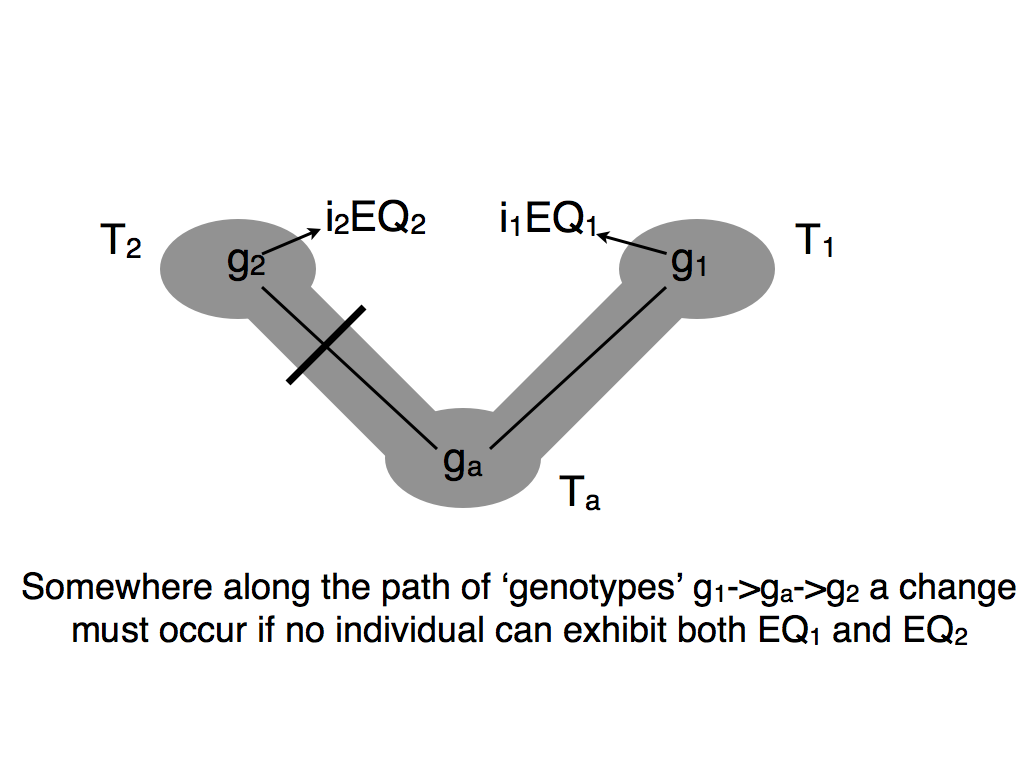
Slide 8: Change Detection using incompatible qualities
Slide 9: Change Detection between individuals, using gene-tree species-tree
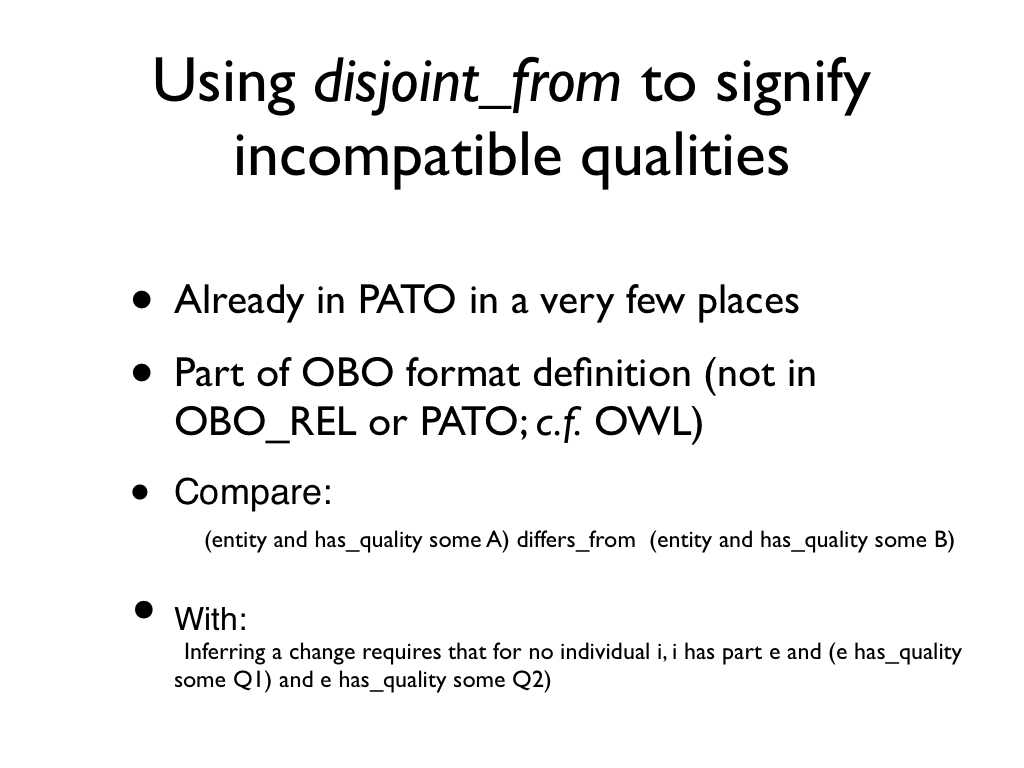
Slide 10: Disjoint_with and incompatible qualities
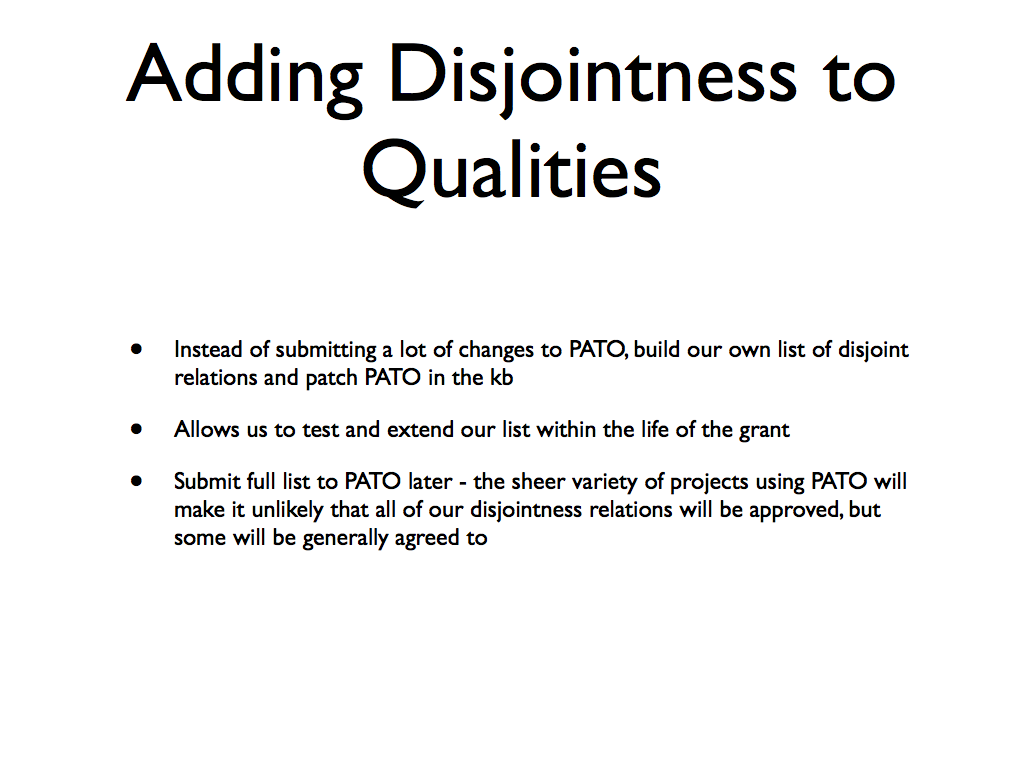
Slide 11: Changing PATO
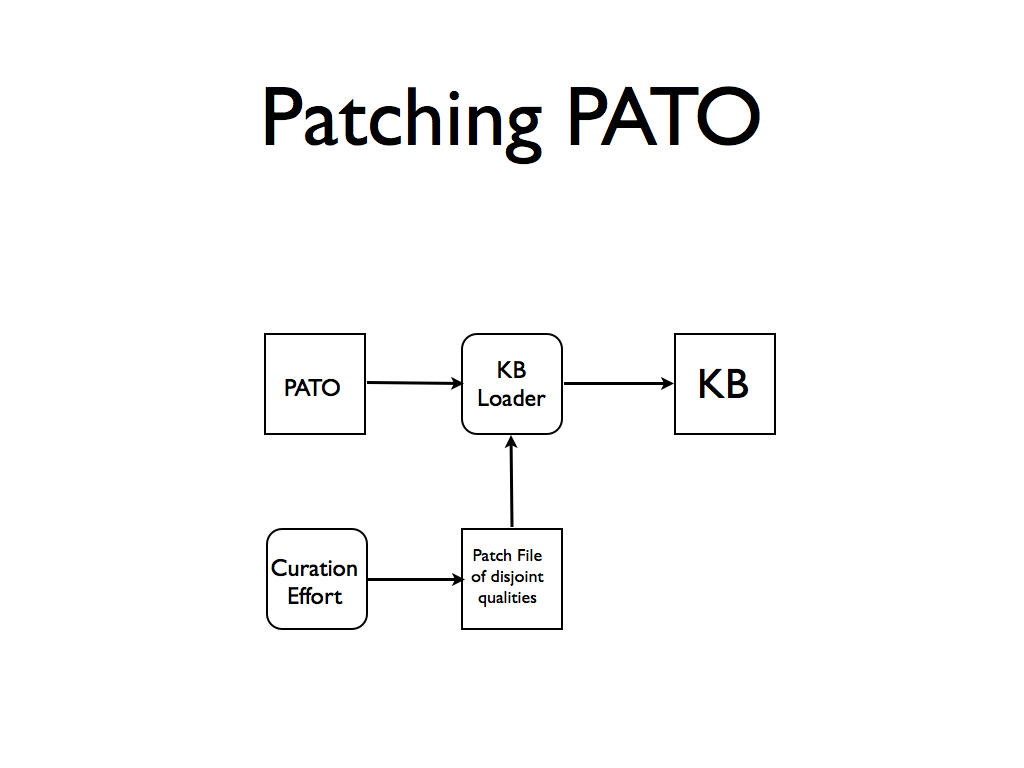
Slide 12: Patching Process Flow
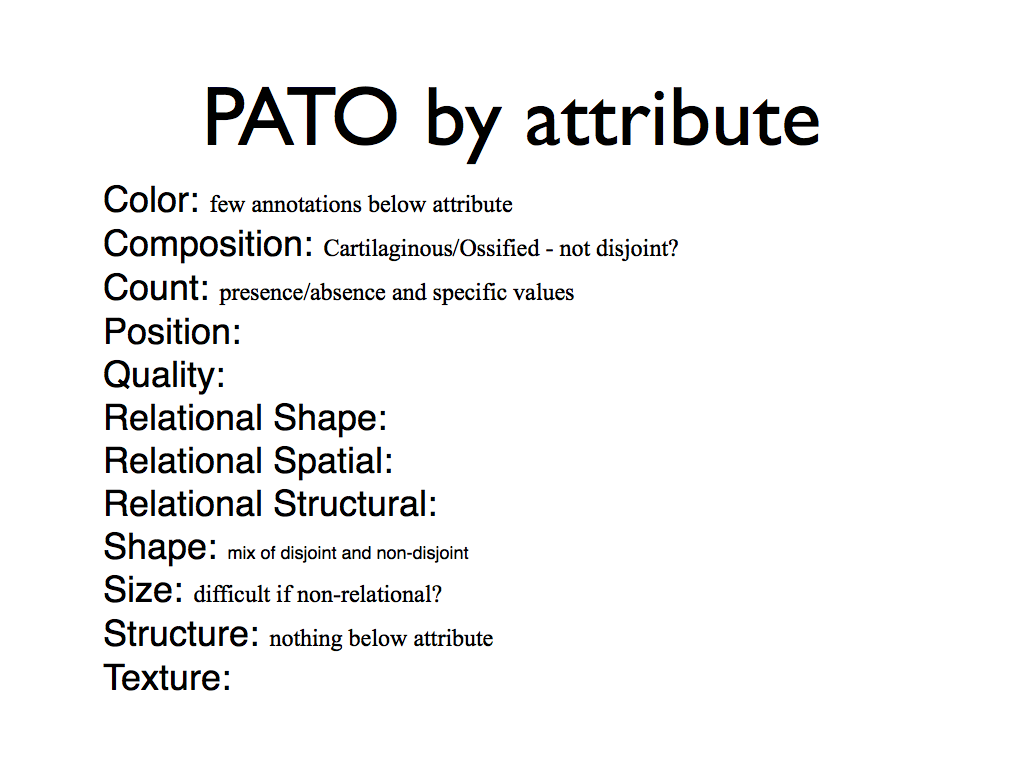
Slide 13: PATO breakdown by attribute
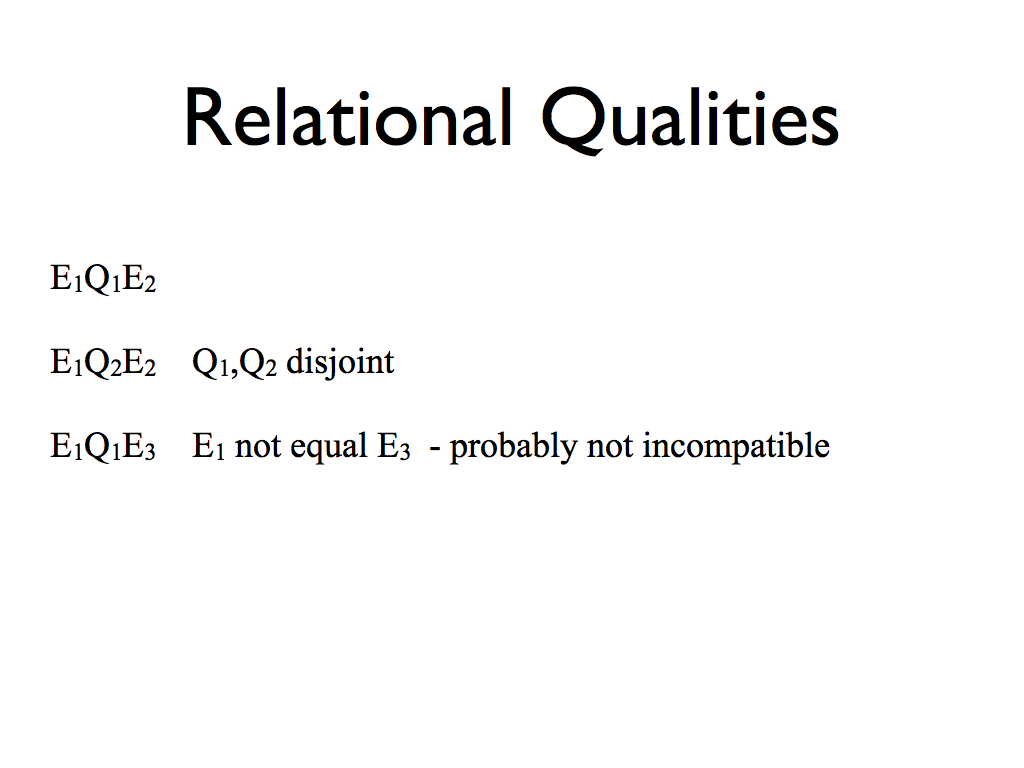
Slide 14: Incompatibility and Relational Qualities
Slide 15: Transition to Correlation
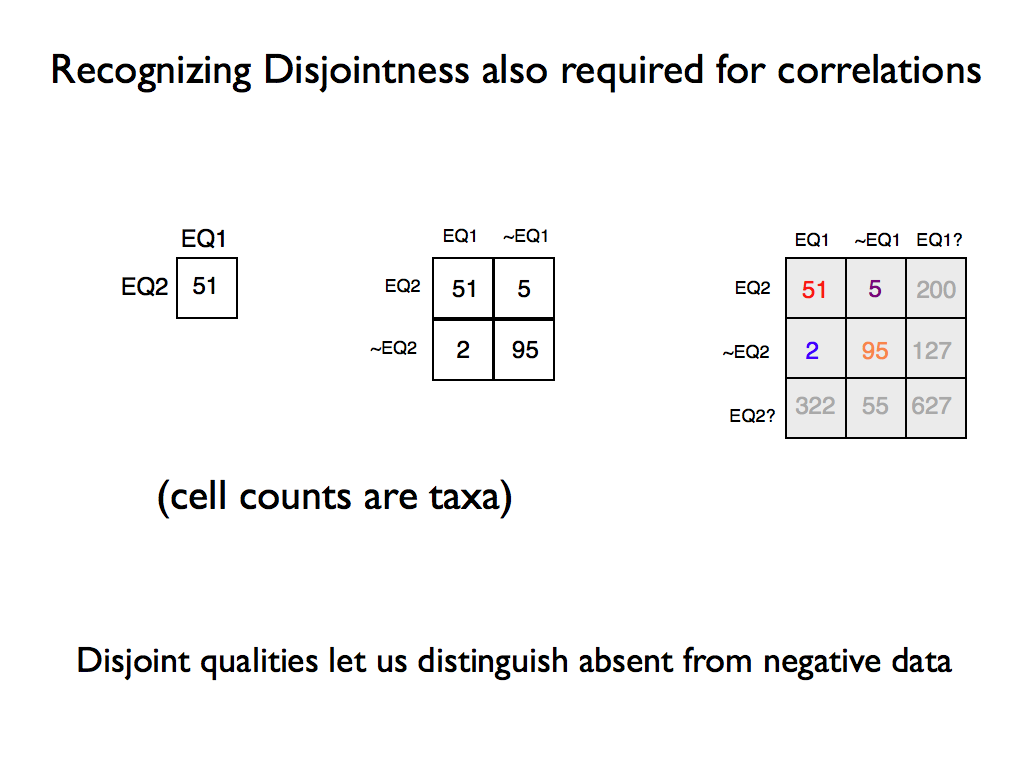
Slide 16: Correlation and Contingency Tables
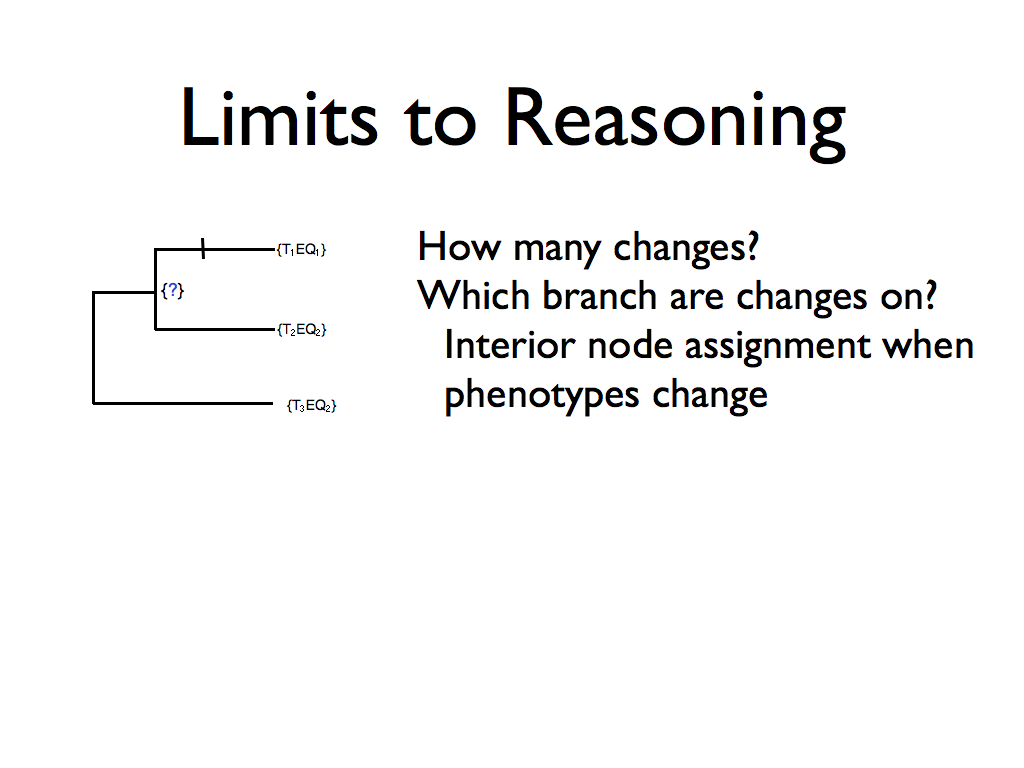
Slide 17: Reasoning only takes us so far
Notes from March 30, 2010 meeting
Attending: Jim Balhoff, Wasila Dahdul, Cartik Kothari, Todd Vision, Paula Mabee, Hilmar Lapp, Monte Westerfield, Peter Midford.
Peter presented the preceding slides. There was some discussion of the definition of disjoint, as mentioned on slide 5. OBO's definition refers to classes with no common members (as does OWL's). PM pointed out that entities related by develops_from may exhibit incompatible qualities. This might be a general problem related to temporal reasoning (entities changing qualities over time).
TJV questioned the need for optimization for the use case of placing a phenotype change on a tree, citing the example of identifying where on a tree a change corresponding to a phenotype of a zebrafish gene mutation. Peter did not have an immediate answer for this.
There was discussion of the difference between annotation of phenotype differences between taxa, which might explicitly reference other taxa, and zebrafish gene phenotypes which implicitly refer to the wild type.
TJV mentioned liking the current Phenotype Profile interface (taxon tree on slide 3) and seemed to indicate that he thought showing contrasts in co-occurrence counts between sister taxa was good enough. HL observed that although the use cases did mention correlation, the usage was loose and that co-occurrence was closer to the intended meaning.
Overall the sense was that optimization was not required for the use cases we are planning to deliver by the end of the initial grant. Also that the issue of incompatible qualities is messy and it wasn't absolutely clear that we needed to address it at this point. PM asked Peter to send her some use cases to review.
JPB doubted whether adding disjoint_from relations between PATO qualities was sufficient and pointed out that almost any quality annotation to an entity is incompatible with an absent annotation. JPB thinks that handling this by adding a collection of disjoint_from relations would probably not work. HL brought up the issue of count ranges (e.g., 0-5, which is implicitly a polymorphism including absence as a possible 'state'). Count values will need special treatment in any approach to incompatibility as current curation practice is to put them in comment strings.
There were numerous audio problems with Adobe connect and we eventually switched to phones for the audio.
